40 Best Infographic Design Ideas to Jumpstart your Creativity - Learn Infographic Design Tutorial
Are you trying to think outside the box when it comes to your business's designs? These 40 infographic design ideas can help you to create awesome designs that educate your audience and promote your business. Get started today: https://www.visme.co/make-infographics/
---
In this video, Mike from Visme is back to show you various infographic types, examples, and why infographics are one of the best marketing tools out there.
Infographics can also be used in teaching, research, and media for better communication and a more powerful impact. This video will show you 40 infographic design ideas you can use depending on your industry, message purpose, and audience.
Visit our blog to learn more about infographic ideas and examples:
https://visme.co/blog/infographic-ideas/
You can also download Visme’s FREE beginner’s guide on creating amazing infographics from scratch: https://www.visme.co/how-to-make-an-infographic/
Unsure of where to start when it comes to infographic design? Our visual beginner's guide which illustrates several types of infographics, those being:
1. A mixed-chart infographic includes a variety of different charts to show data.
2. A list is mostly text that lists information about a given subject.
3. A timeline looks at how a subject has changed over time.
4. A how-to guide is a step-by-step guide to creating something.
5. A flowchart starts at a single point and branches off based on different decisions.
6. A comparison compares and contrasts two different subjects.
7. A location-based infographic uses a map to look at statistics across a wide range.
8. A photo-graphic uses mostly photographs, combined with text, to explain a point.
9. A hierarchical infographic stacks items or subjects based on a predefined level.
10. A single chart is a chart (such as a bar or line graph) that gives statistics on a subject.
11. Visualized numbers add images to statistics to make them more appealing.
12. An anatomical infographic breaks down what makes something work.
13. A visual resume is a resume in infographic form.
Sources:
https://blog.adioma.com/author/anna-vital/
https://www.business-management-degree.net/popular-articles/amazon-vs-netflix/
https://www.brandingstrategyinsider.com/2013/10/brands-and-beliefs.html#.XHhQnJNKhTY
https://www.entrepreneur.com/article/246768?utm_medium=Social&utm_source=Pinterest
https://www.asicentral.com/asp/open/Research/impressionsstudy/Impressions-Study-shirts.aspx
https://www.noobpreneur.com/2015/11/11/uk-small-business-startup-guide-for-noobs-like-us-infographic/
https://www.coursehero.com/lit/The-Metamorphosis/infographic/
http://anxietyfreechild.com/
https://www.scmp.com/infographics/article/1862273/infographic-tale-two-economies
http://www.studygeek.org/other_lessons/visualizing-pi/
https://popperfont.net/2014/02/24/lovely-science-y-images-by-rachel-ignotofsky/?postpost=v2#content
https://futurism.com/images/our-warming-world-the-future-of-climate-change-infographic/?utm_campaign=coschedule&utm_source=pinterest&utm_medium=Futurism&utm_content=Our%20Warming%20World:%20The%20Future%20of%20Climate%20Change%20%5BINFOGRAPHIC%5D
https://blog.anthonynolan.org/2015/12/the-most-creative-ways-to-fundraise/
https://www.compassion.com/
https://www.squeaky.com/als-bucket-challenge/ALS-Ice-Bucket-Challenge.html
https://www.behance.net/gallery/18185557/Annual-Fund-Infographic
https://mashable.com/2011/07/19/tech-companies-infographic/#vEUWFsjItqq2
https://visme.co/blog/visual-content-expert-tips/
http://www.indigoboom.com/
https://www.zerofox.com/blog/vintage-social-media-infographic/
https://www.whoishostingthis.com/blog/2015/01/26/silicon-valley-secrets/
https://www.behance.net/gallery/21538789/Iceberg-_-Visual-resume-
https://www.ethos3.com
http://www.pbs.org/wnet/nature/siberian-tiger-quest-infographic-all-about-tigers/7844/
https://www.coursehero.com/lit/To-Kill-a-Mockingbird/
http://www.christophniemann.com/portfolio/my-life-in-illustration/
https://www.alamohomes.net/infographic-the-latest-in-mobile-home-sales-data/
https://choozle.com/
https://www.kissmetricshq.com/
https://appliedpsychologydegree.usc.edu/blog/psychology-of-successfully-marketing-to-millennials/
https://www.crowdcompass.com/lp/top-10-myths-of-mobile-event-apps.shtml
https://health.clevelandclinic.org/know-your-family-tree-and-improve-your-health-infographic/
https://www.goinvo.com/features/ebola/
https://mic.com/articles/104472/what-sleep-deprivation-does-to-your-brain-in-one-stunning-infographic#.ZpqtyRbaI
https://betterworks.com
https://www.sireninteractive.com/rare-disease-and-precision-medicine-infographic
https://www.researchgate.net/publication/49755442_Restorative_Regeneration_of_Digital_Tips_in_the_African_Clawed_Frog_Xenopus_laevis_Daudin
https://www.forbes.com/sites/daviddisalvo/2013/04/02/president-obama-pitches-brain-mapping-project-but-are-we-late-to-the-table/#428f51be45da
http://www.outonthefields.com/media/
https://visual.ly/community/infographic/lifestyle/wallet-experiment
Видео 40 Best Infographic Design Ideas to Jumpstart your Creativity - Learn Infographic Design Tutorial канала Visme
Показать
Комментарии отсутствуют
Информация о видео
Другие видео канала
 14 Infographic Do's and Don'ts to Design Beautiful and Effective Infographics
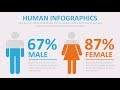 PowerPoint Animation Tutorial Infographic
 Five Data Storytelling Tips to Improve Your Charts and Graphs
 Presentation Skills: 7 Presentation Structures Used by the Best TED Talks
 Marketing Color Psychology: What Do Colors Mean and How Do They Affect Consumers?
 Illustrator CC Tutorial | 3D Graphic Design | Infographic Design template 04
 Learn the Most Common Design Mistakes by Non Designers
 11 Visual Hierarchy Design Principles - Learn How to Improve and Create Beautiful Graphic Designs
 Can I Use That Picture in My Design? How to Legally Use Copyrighted Images Online
 31 Creative Presentation Ideas to Delight Your Audience
![How to Make an Infographic in 5 Steps [INFOGRAPHIC DESIGN GUIDE + EXAMPLES]](https://i.ytimg.com/vi/uQXf_d5Mgjg/default.jpg) How to Make an Infographic in 5 Steps [INFOGRAPHIC DESIGN GUIDE + EXAMPLES]
How to Make an Infographic in 5 Steps [INFOGRAPHIC DESIGN GUIDE + EXAMPLES] Making an INFOGRAPHIC on ADOBE ILLUSTRATOR!
 17 Infographic Design Tips Every Marketer Needs to Know
 Visual Design Principles: 5 things you should know to create persuasive content
 How to Create an Infographic - Part 2: Types of Infographics
 How to Create Infographics: Using Only Free Tools
 How to Create Clutter-Free and Clean Infographics With Lots of Information
 How To Create an Infographic with Adobe Illustrator
 How to Create an Infographic - Part 1: What Makes a Good Infographic?