- Популярные видео
- Авто
- Видео-блоги
- ДТП, аварии
- Для маленьких
- Еда, напитки
- Животные
- Закон и право
- Знаменитости
- Игры
- Искусство
- Комедии
- Красота, мода
- Кулинария, рецепты
- Люди
- Мото
- Музыка
- Мультфильмы
- Наука, технологии
- Новости
- Образование
- Политика
- Праздники
- Приколы
- Природа
- Происшествия
- Путешествия
- Развлечения
- Ржач
- Семья
- Сериалы
- Спорт
- Стиль жизни
- ТВ передачи
- Танцы
- Технологии
- Товары
- Ужасы
- Фильмы
- Шоу-бизнес
- Юмор
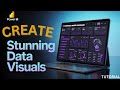
Create Your Own Exciting POWER BI Data Analyst Project
Learn how to create your own POWER BI data analyst project from scratch.
This video will guide you through the process of designing and building a comprehensive data analysis project using POWER BI, a powerful business analytics service by Microsoft. You will learn how to connect to various data sources, create interactive dashboards, and generate insightful reports.
By the end of this video, you will have a solid understanding of how to create a POWER BI project that can help you make data-driven decisions and drive business growth. Whether you are a beginner or an experienced data analyst, this video will provide you with the skills and knowledge you need to create your own POWER BI data analyst project.
Create your own POWER BI data analyst project today and start analyzing your data like a pro.
---
⬇️ **DOWNLOADS** ⬇️
*Final Power BI Report (.pbix):* [https://github.com/elizabethwanjiku703/Youtube/blob/main/Tutorial%209/Retail%20Report%20Dashboard.pbix]
*Dataset (from Kaggle):* [https://www.kaggle.com/datasets/shubham2703/smartphone-retail-outlet-sales-data/data]
---
⏰ *TIMESTAMPS* ⏰
00:00 - Final Report Preview & Introduction
00:52 – Creating KPIs (Total Revenue, YoY Growth, etc.)
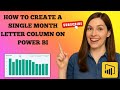
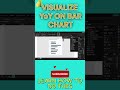
09:42 – Creating a Rounded Column Chart
12:06 – Creating a Donut Chart for Product Categories
14:25 – Creating a Clustered Bar Chart for Top Products
17:11 – Creating a Decomposition Tree for Analysis
19:54 – Creating a Stacked Bar Chart for Payment Types
---
💡 *KEY SKILLS YOU WILL LEARN* 💡
✅ Writing DAX Measures for complex KPIs.
✅ Calculating Year-over-Year (YoY) Growth.
✅ Using custom visuals for modern chart designs.
✅ Building a variety of essential charts (Bar, Donut, Column).
✅ Using the Decomposition Tree for powerful drill-down analysis.
✅ Designing a clean and professional dashboard layout.
This video provides practical, step-by-step instructions that you can apply to your own Power BI projects.
#powerbi #businessintelligence #datavisualization #dax #PowerBI #howtopowerbi
Видео Create Your Own Exciting POWER BI Data Analyst Project канала Data Bloom
This video will guide you through the process of designing and building a comprehensive data analysis project using POWER BI, a powerful business analytics service by Microsoft. You will learn how to connect to various data sources, create interactive dashboards, and generate insightful reports.
By the end of this video, you will have a solid understanding of how to create a POWER BI project that can help you make data-driven decisions and drive business growth. Whether you are a beginner or an experienced data analyst, this video will provide you with the skills and knowledge you need to create your own POWER BI data analyst project.
Create your own POWER BI data analyst project today and start analyzing your data like a pro.
---
⬇️ **DOWNLOADS** ⬇️
*Final Power BI Report (.pbix):* [https://github.com/elizabethwanjiku703/Youtube/blob/main/Tutorial%209/Retail%20Report%20Dashboard.pbix]
*Dataset (from Kaggle):* [https://www.kaggle.com/datasets/shubham2703/smartphone-retail-outlet-sales-data/data]
---
⏰ *TIMESTAMPS* ⏰
00:00 - Final Report Preview & Introduction
00:52 – Creating KPIs (Total Revenue, YoY Growth, etc.)
09:42 – Creating a Rounded Column Chart
12:06 – Creating a Donut Chart for Product Categories
14:25 – Creating a Clustered Bar Chart for Top Products
17:11 – Creating a Decomposition Tree for Analysis
19:54 – Creating a Stacked Bar Chart for Payment Types
---
💡 *KEY SKILLS YOU WILL LEARN* 💡
✅ Writing DAX Measures for complex KPIs.
✅ Calculating Year-over-Year (YoY) Growth.
✅ Using custom visuals for modern chart designs.
✅ Building a variety of essential charts (Bar, Donut, Column).
✅ Using the Decomposition Tree for powerful drill-down analysis.
✅ Designing a clean and professional dashboard layout.
This video provides practical, step-by-step instructions that you can apply to your own Power BI projects.
#powerbi #businessintelligence #datavisualization #dax #PowerBI #howtopowerbi
Видео Create Your Own Exciting POWER BI Data Analyst Project канала Data Bloom
power bi project power bi tutorial data analyst power bi tutorial for beginners how to use power bi power bi dashboard data analytics power bi dashboard design data visualization dashboard design data analysis interactive dashboard Microsoft Power BI data storytelling power bi examples power bi dashboard in power bi modern dashboard power bi sales dashboard business analyst power query
Комментарии отсутствуют
Информация о видео
26 августа 2025 г. 17:00:23
00:23:46
Другие видео канала