- Популярные видео
- Авто
- Видео-блоги
- ДТП, аварии
- Для маленьких
- Еда, напитки
- Животные
- Закон и право
- Знаменитости
- Игры
- Искусство
- Комедии
- Красота, мода
- Кулинария, рецепты
- Люди
- Мото
- Музыка
- Мультфильмы
- Наука, технологии
- Новости
- Образование
- Политика
- Праздники
- Приколы
- Природа
- Происшествия
- Путешествия
- Развлечения
- Ржач
- Семья
- Сериалы
- Спорт
- Стиль жизни
- ТВ передачи
- Танцы
- Технологии
- Товары
- Ужасы
- Фильмы
- Шоу-бизнес
- Юмор
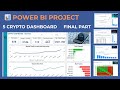
How to Build a 3D Interactive Tesla Dashboard in Power BI | Full Power BI Tutorial
Bring your dashboards to life with this 3D Interactive Tesla Dashboard in Power BI!
Download all the resources here 👉
https://drive.google.com/drive/folders/1vdBucA7ytTW_W77k-HTY_RuCtkSmwGKM?usp=sharing
Learn how to build a fully interactive, professional Power BI dashboard with real Tesla data. This tutorial covers data modeling, DAX formulas, custom visuals, slicers, KPIs, and advanced dashboard design for powerful data storytelling and business intelligence.
Tools used: Power BI Desktop, Power Query, DAX, and custom visual design.
Perfect for data analysts, BI developers, and Power BI beginners wanting to master interactive dashboards, data analysis, and visualization.
⏲TIMESTAMPS
00:45 Introduction
05:15 Load and Transform Data in Power BI
11:20 Explanation Of Data into Power BI
14:30 Creating Measures and Columns in Power BI
19:55 Creating KPI Card Visual in Power BI
38:00 Creating Sparkline in Power BI
47:35 Importing Chicklet slicer in Power BI
57:55 Importing simple image viewer in power BI
59:25 Creating Bar Chart
01:04:00 Creating and editing Donut Chart in Power BI
01:10:10 Creating Button in Power BI
01:14:10 Reviewing and fInalising the Dashboard
If you found this helpful, please like, share, comment, and subscribe for more Power BI tutorials.
#powerbi #powerbitutorial #dataanalytics #dax #dashboarddesign #datavisualization #dataanalysis #businessintelligence
Видео How to Build a 3D Interactive Tesla Dashboard in Power BI | Full Power BI Tutorial канала Isaac Emmanuel
Power BI Power BI tutorial Tesla dashboard interactive dashboard 3D dashboard data visualization business intelligence data analysis DAX Power BI Power BI dashboard design Power BI step by step Power BI tips Power BI for beginners dashboard tutorial data storytelling dashboard design tips Power BI custom visuals KPI dashboard Power BI Power BI interactive report Power BI data modeling beginner Power BI tutorial
Комментарии отсутствуют
Информация о видео
8 августа 2025 г. 23:00:16
01:24:47
Другие видео канала