- Популярные видео
- Авто
- Видео-блоги
- ДТП, аварии
- Для маленьких
- Еда, напитки
- Животные
- Закон и право
- Знаменитости
- Игры
- Искусство
- Комедии
- Красота, мода
- Кулинария, рецепты
- Люди
- Мото
- Музыка
- Мультфильмы
- Наука, технологии
- Новости
- Образование
- Политика
- Праздники
- Приколы
- Природа
- Происшествия
- Путешествия
- Развлечения
- Ржач
- Семья
- Сериалы
- Спорт
- Стиль жизни
- ТВ передачи
- Танцы
- Технологии
- Товары
- Ужасы
- Фильмы
- Шоу-бизнес
- Юмор
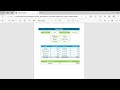
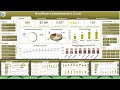
Predictive Analytics: Profit Optimizer in Excel using Multiple Regression
#MultipleRegression #PredictiveAnalytics
Hello Friends,
In this video, you will learn how to create a Profit Optimizer using the Multiple Regression in Microsoft Excel. We have explained it using Excel Formula and Data Analysis Add-in.
Please download the practice file from below given link:
https://www.pk-anexcelexpert.com/profit-optimizer-in-excel-using-multiple-regression/
Download our free Excel utility Tool and improve your productivity:
https://www.pk-anexcelexpert.com/products/pks-utility-tool-v1-0/
See our Excel Products:
https://www.pk-anexcelexpert.com/products/
Visit to learn more:
Chart and Visualizations: https://www.pk-anexcelexpert.com/category/blogs/charts-and-visualization/
VBA Course: https://www.pk-anexcelexpert.com/vba/
Download useful Templates: https://www.pk-anexcelexpert.com/category/templates/
Dashboards: https://www.pk-anexcelexpert.com/excel-dashboard/
Watch the best info-graphics and dynamic charts from below link:
https://www.youtube.com/playlist?list=PLbDvAYjpWJ7CEAHn-iuGSeLbUtFnYekHr
Learn and free download best excel Dashboard template:
https://www.youtube.com/playlist?list=PLbDvAYjpWJ7CpupRYMRkXSN0L92t7nUuF
Learn Step by Step VBA:
https://www.youtube.com/playlist?list=PLbDvAYjpWJ7BcoaFQD-syOrZzNSLZycwH
Website:
https://www.PK-AnExcelExpert.com
Facebook:
https://www.facebook.com/PKAnExcelExpert
Telegram:
https://t.me/joinchat/AAAAAE2OnviiEk5o1o8i4w
Pinterest:
https://www.pinterest.com/PKAnExcelExpert/
Send me your queries on telegram:
@PKanExcelExpert
************* Suggested Books *********
VBA: https://amzn.to/2TMMikX
Excel Dashboard: https://amzn.to/2WZi2Fj
Power Query: https://amzn.to/2Ibd7xR
Power Pivot and Power BI: https://amzn.to/2DCg8BB
Exam Ref 70-778 (Power BI): https://amzn.to/2GnWYTN
************* My Stuff ****************
Mic : https://amzn.to/2TLnF88
Video Editor: https://screencast-o-matic.com/refer/cFe0Q6jzoA
Видео Predictive Analytics: Profit Optimizer in Excel using Multiple Regression канала PK: An Excel Expert
Profit Optimization in Excel Sale Price Optimization in Excel Multiple Regression in Excel Coefficient of Determination in Excel R Squired value in Excel Sale Price Prediction model in Excel Discount Prediction model in Excel Data Analysis Tool Pack in Excel Multiple Regression Equation in Excel Advanced Analytics Machine Learning Data Science
Комментарии отсутствуют
Информация о видео
19 декабря 2019 г. 15:29:02
00:12:59
Другие видео канала