- Популярные видео
- Авто
- Видео-блоги
- ДТП, аварии
- Для маленьких
- Еда, напитки
- Животные
- Закон и право
- Знаменитости
- Игры
- Искусство
- Комедии
- Красота, мода
- Кулинария, рецепты
- Люди
- Мото
- Музыка
- Мультфильмы
- Наука, технологии
- Новости
- Образование
- Политика
- Праздники
- Приколы
- Природа
- Происшествия
- Путешествия
- Развлечения
- Ржач
- Семья
- Сериалы
- Спорт
- Стиль жизни
- ТВ передачи
- Танцы
- Технологии
- Товары
- Ужасы
- Фильмы
- Шоу-бизнес
- Юмор
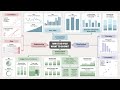
Area Chart with Custom Borders in Tableau
Want to learn Tableau fast? This step by step tutorial shows you how to create an area chart with custom borders in Tableau by layering a line chart on top. You’ll learn how to design a clean, modern visual that adds polish to any dashboard while staying easy to read and beginner-friendly. Ideal for Tableau users who want to upgrade their charts without complicated techniques or extra formatting.
📌 Part of the Learn Tableau Fast series: https://youtu.be/Opja46x20rw
The best way to learn Tableau is to start building. These no-fluff tutorials focus on useful visuals that help you get comfortable with the tool one chart at a time.
Tableau: https://public.tableau.com/app/profile/samantha.cohn/viz/LearnTableauFast8EasyVisuals/Dashboard1
Tableau Video Index: https://sites.google.com/view/tableau-video-index/home
#Tableau #DataVisualization #TableauTutorial
Видео Area Chart with Custom Borders in Tableau канала Golden Insights
Комментарии отсутствуют
Информация о видео
18 декабря 2025 г. 19:55:01
00:01:42
Другие видео канала