- Популярные видео
- Авто
- Видео-блоги
- ДТП, аварии
- Для маленьких
- Еда, напитки
- Животные
- Закон и право
- Знаменитости
- Игры
- Искусство
- Комедии
- Красота, мода
- Кулинария, рецепты
- Люди
- Мото
- Музыка
- Мультфильмы
- Наука, технологии
- Новости
- Образование
- Политика
- Праздники
- Приколы
- Природа
- Происшествия
- Путешествия
- Развлечения
- Ржач
- Семья
- Сериалы
- Спорт
- Стиль жизни
- ТВ передачи
- Танцы
- Технологии
- Товары
- Ужасы
- Фильмы
- Шоу-бизнес
- Юмор
Report in 90 seconds by Power BI
#powerbi #shorts #shorts #powerbi
===
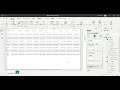
The video is a tutorial demonstrating how to create a report in Power BI in 90 seconds. It covers the following steps:
Creating a Pie Chart: The video begins by showing the Power BI interface and then guides on creating a pie chart by selecting the visual and dragging "Sales" and "Product" to it [00:00, 00:05].
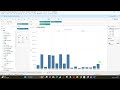
Changing Chart Type to Area Chart: It then shows how to change the pie chart to an area chart [00:21].
Adding Data to Area Chart: For the area chart, "Date" is added to the X-axis and "Country" to the "Small Multiples" field [00:30, 00:39].
Adding Card Visuals: Two card visuals are added to display total sales and total COGS (Cost of Goods Sold) [00:55, 01:16].
Interactivity Demonstration: Finally, the tutorial illustrates how selecting a segment of the pie chart updates the sales and COGS figures in the card visuals for the chosen product [01:20].
Report Conclusion: The video ends by showing the updated report with the selected product's data [01:39].
Видео Report in 90 seconds by Power BI канала AIデータ活用パートナー
===
The video is a tutorial demonstrating how to create a report in Power BI in 90 seconds. It covers the following steps:
Creating a Pie Chart: The video begins by showing the Power BI interface and then guides on creating a pie chart by selecting the visual and dragging "Sales" and "Product" to it [00:00, 00:05].
Changing Chart Type to Area Chart: It then shows how to change the pie chart to an area chart [00:21].
Adding Data to Area Chart: For the area chart, "Date" is added to the X-axis and "Country" to the "Small Multiples" field [00:30, 00:39].
Adding Card Visuals: Two card visuals are added to display total sales and total COGS (Cost of Goods Sold) [00:55, 01:16].
Interactivity Demonstration: Finally, the tutorial illustrates how selecting a segment of the pie chart updates the sales and COGS figures in the card visuals for the chosen product [01:20].
Report Conclusion: The video ends by showing the updated report with the selected product's data [01:39].
Видео Report in 90 seconds by Power BI канала AIデータ活用パートナー
Комментарии отсутствуют
Информация о видео
5 января 2026 г. 7:14:41
00:01:41
Другие видео канала