26. How to Trade the Average Directional Index (ADX)
Practice these concepts with a free practice charting and trading account here: http://bit.ly/forex-demo1
For the full lesson with images, text, links, and discussion, go here: http://www.informedtrades.com/4525-adx-how-trade-trends-using-adx.html
For our full beginner course in technical analysis and trading, go here: http://www.informedtrades.com/index.php?page=freetradingcourses
Link to the formulas behind the ADX: http://hubpages.com/hub/ADX
Link to Additional Resources on Trading the ADX: http://www.informedtrades.com/4529-six-resources-help-you-trade-adx.html
And of course, don't forget to jump start your learning as a trader by registering as a member of our learning community: http://www.informedtrades.com
VIDEO NOTES
A lesson on how to trade the ADX for traders of the stock, futures, and forex markets.
In this lesson we are going to learn about the Average directional Index (ADX), an indicator which helps traders determine when the market is trending, when the market is ranging, when the market may be about to change from trending to ranging or vice versa, and to gauge the strength of the trend in the market.
When plotted below the chart the ADX Line is normally accompanied by two other lines which are known as the +DI and --DI Lines.
I am not going to go into the formulas for the Indicator here however you do need to know that:
• The ADX line is composed of two other indicators which are known as the Positive Directional Index (+DI Line) and the Negative Directional Index (-DI Line).
• The +DI Line is representative of how strong or weak the uptrend in the market is.
• The --DI line is representative of how strong or weak the downtrend in the market is.
• As the ADX line is comprised of both the +DI Line and the --DI Line, it does not indicate whether the trend is up or down, but simply the strength of the overall trend in the market.
If you would like a deeper explanation of the computation of the indicator you can find it here: http://hubpages.com/hub/ADX
As the ADX Line is Non Directional, it does not tell you whether the market is in an uptrend or a downtrend (you must look to price or the +DI/-DI Lines for this) but simply how strong or weak the trend in the financial instrument you are analyzing is. When the ADX line is above 40 and rising this is indicative of a strong trend, and when the ADX line is below 20 and falling this is indicative of a ranging market.
So one of the first ways traders will use the ADX in their trading is as a confirmation of whether or not a financial instrument is trending, and to avoid choppy periods in the market where many find it harder to make money. In addition to a situation where the ADX line trending below 20, the developer of the indicator recommends not trading a trend based strategy when the ADX line is below both the +DI Line and the --DI Line.
Another way that traders use this indicator is to identify the potential start of a new trend in the market. Very simply here they will look from below the 20 line to above the 20 line as a signal that the market may be beginning a new trend. The longer the market has been ranging, the greater the weight that most traders will give this signal
Another way traders use the ADX is as a signal of trend reversals. When the ADX is trading above both the +DI line and the --DI line and then turns lower this is often a signal that the current trend in the market is reversing and traders will position themselves accordingly:
The final example that I am going to cover on how traders use the ADX is to position to trade long when the +DI crosses above the --DI (as this is a sign that the buyers are winning out over the sellers) and to position to trade short when the +DI line crosses below the --DI (as this is a sign that the sellers are winning over the buyers). As with the other crossover strategies that we have covered used alone, the DI crossover is prone to many false signals.
That completes our lesson for today. You should now have a good understanding of the ADX and several different ways that traders use this in their trading. In tomorrow's lesson we are going to look at a new indicator which is called the Parabolic SAR, which many traders use to set stops when trading trends in the market.
Видео 26. How to Trade the Average Directional Index (ADX) канала InformedTrades
Показать
Комментарии отсутствуют
Информация о видео
Другие видео канала
 The Correct and Easy Way to Understand adx Indicator | Learn Technical Analysis
 The Top 5 Technical Indicators for Profitable Trading
 How To Use The ADX Indicator
 The ATR Indicator Is The Single Best Indicator Forex Traders Can Have (Use It or Lose It)
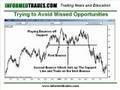 36. Two Trading Mistakes Which Will Destroy Your Account
 Learn the SECRET to Trading Fibonacci Retracements
 One Trading Indicator Every Trader Should Use by Greg Weitzman of Trading Zone
 ADX - THE TREND STRENGTH INDICATOR - EXPLAINED
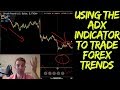 Using The ADX Indicator To Find And Trade Forex Trends
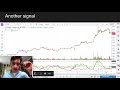 Using the DMI indicator to trade Cryptocurrencies
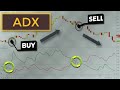 ADX DMI Day Trading Strategy | How To Use The ADX Indicator
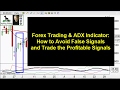 Forex Trading the ADX Indicator
 Best VWAP Indicator Trading Strategy EVER!!! How to use VWAP Indicator Intraday Trading Strategy
 adx indicator in hindi - share market for beginners - trading chanakya
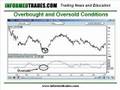 22.How to Trade the Relative Strength Index (RSI) Like a Pro
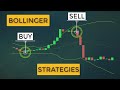 Bollinger Bands Strategies THAT ACTUALLY WORK | Trading Systems With BB Indicator
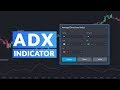 Beginner's Guide to the Average Directional Index Indicator
 41. How to Use the Average True Range (ATR) To Set Stops
 ADX INDICATOR SECRETS - Is That Instrument Worth Trading?