- Популярные видео
- Авто
- Видео-блоги
- ДТП, аварии
- Для маленьких
- Еда, напитки
- Животные
- Закон и право
- Знаменитости
- Игры
- Искусство
- Комедии
- Красота, мода
- Кулинария, рецепты
- Люди
- Мото
- Музыка
- Мультфильмы
- Наука, технологии
- Новости
- Образование
- Политика
- Праздники
- Приколы
- Природа
- Происшествия
- Путешествия
- Развлечения
- Ржач
- Семья
- Сериалы
- Спорт
- Стиль жизни
- ТВ передачи
- Танцы
- Технологии
- Товары
- Ужасы
- Фильмы
- Шоу-бизнес
- Юмор
Module 29 - Interactive Dashboard in Excel ( Continued)
Elevating Data Visualization with Interactive Dashboards in Excel
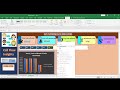
Interactive dashboards in Excel are game-changers for data visualization, offering a dynamic way to explore and present data. These dashboards allow users to interact with datasets through controls like slicers, buttons, and interactive charts. By integrating various elements into a single view, they provide a comprehensive and user-friendly platform to analyze key metrics and uncover insights, making data exploration more engaging and effective.
Excel's interactive dashboards are not just about displaying data; they are about telling a story with it. By enabling users to filter and drill down into specific areas of interest, these dashboards empower teams to make informed decisions quickly. Whether tracking sales performance or monitoring project progress, interactive dashboards in Excel turn complex data into actionable intelligence, all within a visually compelling framework.
#DataVisualization #ExcelDashboards #InteractiveAnalytics #ExcelTips #DataInsights
Видео Module 29 - Interactive Dashboard in Excel ( Continued) канала Seraphim1176
Комментарии отсутствуют
Информация о видео
2 сентября 2024 г. 13:30:03
00:14:41
Другие видео канала