🚦 How I use moving average and Bollinger bands for profitable trading strategy
#technicalindicator #movingaverage #bollingerbands
In this tutorial, you will learn how to build profitable trading strategy and use technical indicators such as moving average and Bollinger Bands in stock market to buy and sell stocks.
The technical analysis indicators such as moving average and moving average crossover can help traders to know the current market trend. MA can also help stock trader to find support and resistance. MA signals bullish when the stock price crosses the average upside and bearish when the stock price crosses below the average. MA trading signals are good during trending zone. To overcome the false breakout of moving average during the sideways market the Bollinger bands can be used.
This educational video also explains the use of Bollinger bands and its trading strategy. Bollinger bands consistent of three lines median line, upper band and lower band.
1.Median line is the average.
2.Upper band is the standard deviation above the average.
3.Lower band is the standard deviation below the average.
The Bollinger bands tends to squeeze during the sideways market as the standard deviation is low. Bollinger bands squeeze trading strategy is very popular among trader to form a profitable strategy.
Stock traders use lots of trading strategies and technical indicators to find a profitable trade. To make profits, amateur traders overlay many indicators on the charts. Most of us forget a very simple truth that, less is more in trading. The lesser the technical indicators you use, the chances of becoming profitable increases. If we look at professional traders, their trading terminal consist of very few simple indicators because they know that, simple things work the best. Professional traders know when, where and which technical indicators to be used in their trading strategies. This video explains the basics of moving average and Bollinger bands and also highlights when, where and which indicator to be used in the appropriate time. Every indicator has its own drawbacks. Traders must know not only when to use technical indicators but also when not to use it. This tutorial also explains why moving average indicator works best in trending zone and how Bollinger bands can help trader to avoid false breakout during non-trending zone.
We hope that, this trading education video has helped you in improving your knowledge in technical
Indicators; moving average and Bollinger bands. For further trading educational videos do check
other videos in our YouTube channel.
Reference Link:
Read More about moving average indicator: https://www.investopedia.com/terms/m/movingaveragechart.asp
https://school.stockcharts.com/doku.php?id=technical_indicators:moving_averages
https://www.eqsis.com/how-to-use-moving-average/
Watch 3 useful trading strategies using RSI indicator at https://youtu.be/bIsaSbe4yLU
Видео 🚦 How I use moving average and Bollinger bands for profitable trading strategy канала EQSIS
Показать
Комментарии отсутствуют
Информация о видео
Другие видео канала
 Bollinger Bands and RSI Trading Strategy (Simple and Effective)
 ✔️ Option Buying Get It Right!: Essential Step-by-Step Guide to Become Successful
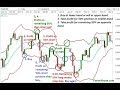 Master Bollinger Bands in Just One Class
 Bollinger Band Trading Strategy
 🔴 How To Use The RSI Indicator For PERFECT "SNIPER" ENTRIES Correctly
![🔑 Option Strategy: [Straddle] Why it works and its Limitations. - EQSIS](https://i.ytimg.com/vi/RRI7z9J1MuE/default.jpg) 🔑 Option Strategy: [Straddle] Why it works and its Limitations. - EQSIS
🔑 Option Strategy: [Straddle] Why it works and its Limitations. - EQSIS Bollinger Bands Trading Strategy: How to Trade it Like a PRO
 BEST Bollinger Band Strategy (High Winrate)
 🔴 The Only "DOUBLE BOLLINGER BANDS" Trading Strategy You Will Ever Need (FULL TUTORIAL)
 50 SIMPLE MOVING AVERAGE + BOLLINGER BANDS STRATEGY | FULL STRATEGY | MASTERY
 Bollinger Bands Strategies THAT ACTUALLY WORK (Trading Systems With BB Indicator)
 Why people go wrong in option trading?
 How to pick stock for intraday trading
 Bollinger Bands + Moving Average | Xpert Nifty | Mitul Mehta Technical Analysis & Strategy
 Profitable Bollinger Band Trading Strategies|Bollinger Bands Moving Average Crossover Strategies
 Best Technical indicators| ADX Indicator with Bollinger Band
 How To Combine Bollinger Bands & Volume (Forex & CFD Stock BB Squeeze Trading Strategy)
 How to find stocks that FII/DIIs are buying | FII buying stocks | DII buying stocks | fii dii data
 I TESTED a "92% win rate" Bollinger Bands Trading Strategy with NO STOP LOSS - Scalping Strategy 😱