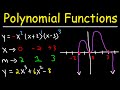
Graphing Higher-Degree Polynomials: The Leading Coefficient Test and Finding Zeros
By now, graphing lines seems trivial, and even graphing quadratics is a piece of cake. But what about higher-degree polynomials like cubics, quartics, and quintics? And even higher than that? It might seem quite daunting, but there are some handy tricks that will help you graph even these very complex functions. These involve using the leading coefficient test to discern the end behavior of the function, as well as plotting zeros and assessing their multiplicities in order to get a rough sketch of the function. It's not as bad as it sounds, check it out!
Watch the whole Mathematics playlist: http://bit.ly/ProfDaveMath
Classical Physics Tutorials: http://bit.ly/ProfDavePhysics1
Modern Physics Tutorials: http://bit.ly/ProfDavePhysics2
General Chemistry Tutorials: http://bit.ly/ProfDaveGenChem
Organic Chemistry Tutorials: http://bit.ly/ProfDaveOrgChem
Biochemistry Tutorials: http://bit.ly/ProfDaveBiochem
Biology Tutorials: http://bit.ly/ProfDaveBio
EMAIL► ProfessorDaveExplains@gmail.com
PATREON► http://patreon.com/ProfessorDaveExplains
Check out "Is This Wi-Fi Organic?", my book on disarming pseudoscience!
Amazon: https://amzn.to/2HtNpVH
Bookshop: https://bit.ly/39cKADM
Barnes and Noble: https://bit.ly/3pUjmrn
Book Depository: http://bit.ly/3aOVDlT
Видео Graphing Higher-Degree Polynomials: The Leading Coefficient Test and Finding Zeros канала Professor Dave Explains
Показать
Комментарии отсутствуют
Информация о видео
21 ноября 2017 г. 21:30:54
00:09:15
Другие видео канала
 How To Graph Polynomial Functions Using End Behavior, Multiplicity & Zeros
 Graphing Trigonometric Functions
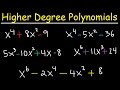 Factoring Higher Degree Polynomial Functions & Equations - Algebra 2
 Solving Higher Degree Polynomials by Synthetic Division and the Rational Roots Test
 Graphing the polynomial function f(x)=x^3-x^2-6x
 Graphing Rational Functions and Their Asymptotes
 Solving and Graphing Polynomial and Rational Inequalities
 Solving Trigonometric Equations
 The things you'll find in higher dimensions
 How to Sketch a Polynomial Function
 How to graph a rational function using 6 steps
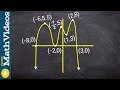 Label the zeros, multiplicity, and determine degree and LC from a graph
 How To Factor Polynomials The Easy Way!
 Solving Polynomial Inequalities
 Polar Coordinates and Graphing Polar Equations
 Optimization Problems in Calculus
 Graph Quadratic Equations without a Calculator - Step-By-Step Approach
 sketch the graph of polynomials using zeros, end behavior, and y int
 Graphing Polynomial Functions Using End Behavior, Zeros, and Multiplicities