Sales Dashboard in Power BI | Power BI Dashboard
✔ Download the Excel data file for Practice & dashboard background Image:
https://leanexcelsolutions.com/sales-dashboard-in-excel-power-bi/
✔ Download the dashboard & all resource files from the store:
https://leanexcelsolutions.com/product/sales-dashboard-in-power-bi/
In this video, it is demonstrated to create a sales dashboard in Power BI. A similar dashboard is created in Microsoft Excel earlier. The link to watch it is provided below.
Sales Dashboard in Excel: https://youtu.be/bjLIA1vSqGs
Timeline:
00:00 Overview
01:15 Import Data to Power BI
01:52 Edit Data in Power Query Editor
03:02 Create Columns & Measures
04:41 Create Visuals
10:50 Format Dashboard Background
12:09 Format Visuals
Recommended Videos:
✔ Interactive Sales Dashboard for B2C Business: https://youtu.be/bjLIA1vSqGs
✔ Customer Analytics Dashboard in Power BI: https://youtu.be/0mwToWeybS0
Recommended Playlist:
Stock Portfolio Dashboard: https://youtube.com/playlist?list=PLYjYcSjCw_LVwmbPXEEmRwOGzh_M_vLNf
Check the Links:
◼ Channel: https://www.youtube.com/c/LeanExcelSolutions
◼ Website: https://leanexcelsolutions.com
◼ Facebook: https://www.facebook.com/LeanExcelSolutions/
◼ Instagram: https://www.instagram.com/leanexcelsolutions/
✔ Share this Video:
https://youtu.be/CGgXHsD19Ek
#powerbi
#powerbitutorials
#powerbidashboard
#dashboard
#leanexcelsolutions
#english
Видео Sales Dashboard in Power BI | Power BI Dashboard канала Lean Excel Solutions
Показать
Комментарии отсутствуют
Информация о видео
Другие видео канала
 HR Dashboard | Learning and Development | #excel #dashboard #dataanalysis #tutorial #vba
 Master Data Visualization with Lean Excel Solutions | Excel & Power BI Tutorials
 Learning and Development Dashboard in Excel -Part 2 | Power Pivot | HR Dashboard
 Learning and Development Dashboard in Excel - Part 1 | VBA UserForm | HR Dashboard
 Power BI Theme change
 04 SORTBY Formula in Excel | Dynamic Array Function | SORT Vs SORTBY
 03 SORT Formula in Excel | How to use Sort Function in Excel | Dynamic Array Function
 02 FILTER Formula in Excel | Filter Functions | Dynamic Array Function | Excel 365 | Excel 2021
 Sales Distribution Excel Dashboard
 Add a chart within the cell in Microsoft Excel | Excel tips
 Customers Analytics Dashboard in Microsoft Excel | YouTube shorts
 Customer Analytics Dashboard in Excel - Advanced Visuals & Analysis : Part 2
 Customer Analytics Dashboard in Excel - Setup & Overview : Part 1
 How to separate the chart elements in Excel | YouTube Shorts
 Customer Analytics Dashboard in Power BI using the MS Forms or Google Forms Survey Data
 Customer Analytics Dashboard in Power BI
 Customer Analytics Dashboard in Power BI | MS Forms | Google Forms | Power BI Dashboard
 How to select multiple objects in Excel
 Sales Dashboard in Excel
 Power BI Dashboard | Sales Distribution Dashboard
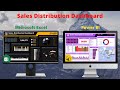 Sales Distribution Dashboard Preview | Excel Dashboard | Power BI Dashboard