- Популярные видео
- Авто
- Видео-блоги
- ДТП, аварии
- Для маленьких
- Еда, напитки
- Животные
- Закон и право
- Знаменитости
- Игры
- Искусство
- Комедии
- Красота, мода
- Кулинария, рецепты
- Люди
- Мото
- Музыка
- Мультфильмы
- Наука, технологии
- Новости
- Образование
- Политика
- Праздники
- Приколы
- Природа
- Происшествия
- Путешествия
- Развлечения
- Ржач
- Семья
- Сериалы
- Спорт
- Стиль жизни
- ТВ передачи
- Танцы
- Технологии
- Товары
- Ужасы
- Фильмы
- Шоу-бизнес
- Юмор
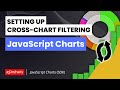
Stacking & Padding Power BI Time Series Chart: Drill Down TimeSeries PRO | Part 9
This video covers the stacking and padding settings available in Drill Down TimeSeries PRO visual for Power BI. Learn how to create Power BI stacked charts, stacking modes and customization. Get Drill Down TimeSeries PRO: https://tinyurl.com/bdera44u
CHAPTERS
1:17 - Formatting Options/Stack Settings
1:55 - Customize Stack Settings
3:03 - Display Order
3:50 - Width Percent
💡 Download the Sample Report from ZoomCharts Academy:
https://tinyurl.com/2yx8waku
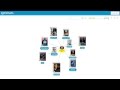
Drill Down TimeSeries PRO lets you combine interactive navigation and rich customization options to create Power BI time series charts that are quick and easy to explore. Click directly on the chart to drill down to months, days or hours. Or pan to select and examine specific time periods in detail. Combine multiple series and choose between multiple Power BI chart types (line, column, area) for each.
📝Learn more:
https://tinyurl.com/yyvnnwcr
ZoomCharts Drill Down Visuals for Power BI are known for their interactive drilldowns, smooth animations and rich customization options. Use them to create Power BI dashboards and reports that business users absolutely love – visually appealing, with intuitive, quick and easy data exploration experience on every device.
📣 Request a demo:
https://tinyurl.com/rtsxnnvu
Видео Stacking & Padding Power BI Time Series Chart: Drill Down TimeSeries PRO | Part 9 канала ZoomCharts
CHAPTERS
1:17 - Formatting Options/Stack Settings
1:55 - Customize Stack Settings
3:03 - Display Order
3:50 - Width Percent
💡 Download the Sample Report from ZoomCharts Academy:
https://tinyurl.com/2yx8waku
Drill Down TimeSeries PRO lets you combine interactive navigation and rich customization options to create Power BI time series charts that are quick and easy to explore. Click directly on the chart to drill down to months, days or hours. Or pan to select and examine specific time periods in detail. Combine multiple series and choose between multiple Power BI chart types (line, column, area) for each.
📝Learn more:
https://tinyurl.com/yyvnnwcr
ZoomCharts Drill Down Visuals for Power BI are known for their interactive drilldowns, smooth animations and rich customization options. Use them to create Power BI dashboards and reports that business users absolutely love – visually appealing, with intuitive, quick and easy data exploration experience on every device.
📣 Request a demo:
https://tinyurl.com/rtsxnnvu
Видео Stacking & Padding Power BI Time Series Chart: Drill Down TimeSeries PRO | Part 9 канала ZoomCharts
Комментарии отсутствуют
Информация о видео
31 июля 2023 г. 15:55:25
00:05:59
Другие видео канала