- Популярные видео
- Авто
- Видео-блоги
- ДТП, аварии
- Для маленьких
- Еда, напитки
- Животные
- Закон и право
- Знаменитости
- Игры
- Искусство
- Комедии
- Красота, мода
- Кулинария, рецепты
- Люди
- Мото
- Музыка
- Мультфильмы
- Наука, технологии
- Новости
- Образование
- Политика
- Праздники
- Приколы
- Природа
- Происшествия
- Путешествия
- Развлечения
- Ржач
- Семья
- Сериалы
- Спорт
- Стиль жизни
- ТВ передачи
- Танцы
- Технологии
- Товары
- Ужасы
- Фильмы
- Шоу-бизнес
- Юмор
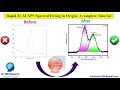
How to Identify the #XRD Phase for the #Prepared Sample using #X’Pert #High Score #Software#Tamil#
#Scientific Data Plots #Identify XRD Phase #using#Xpert High Score#Software#Tamil#
🧑🏫🔬 Welcome to Research Vision Tech 🔬👨💻
In this video, you will learn the step-by-step process of identifying crystal phases from X-ray Diffraction (XRD) data using X’Pert High Score software. Phase identification is one of the most essential steps in materials science, nanotechnology and solid-state chemistry, helping researchers confirm the purity and structure of synthesized materials.
📌 What you’ll learn in this tutorial:
👨💻Introduction to XRD and phase analysis
👨💻Importing XRD data into X’Pert High Score
👨💻Matching peaks with reference patterns (ICDD/PDF database)
👨💻Identifying phases and analyzing results
👨💻Tips for accurate and reliable phase identification
This video is perfect for research scholars, postgraduate students, and scientists working in nanomaterials, photocatalysis, ceramics, catalysts and composites who want to strengthen their data analysis skills.
If you have any inquiries, please feel free to ask via the comment section below. For more videos, kindly subscribe to my channel.
Thank you 🙏🙏
Email ID: srkchemist106@gmail.com
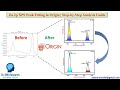
How to plot XRD data using the Origin software
https://youtu.be/Ww1AAsr9y2M
How to plot FTIR data using the Origin software
https://youtu.be/w7lqVG2yQvk
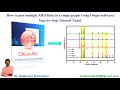
How to plot XRD data &JCPDS + hkl values using the Origin software
https://youtu.be/aLh-2P3xlS4
How to plot smoothing & baseline correction XRD data using the Origin software
https://youtu.be/Pm7tW96iDWs
How to Calculate XRD Particle Size using Scherrer’s Equation
https://youtu.be/MHkyw2_rrrc
How to plot multiple FTIR spectra in a single graph
https://youtu.be/bX_KkA9rTL8
How to Identify the XRD Phase using X’Pert High Score Software
https://youtu.be/CC8NLNQBYas
👉 Don’t forget to Like 👍 | Share 🔗 | Subscribe 🔔 for more research tutorials and scientific content!
Видео How to Identify the #XRD Phase for the #Prepared Sample using #X’Pert #High Score #Software#Tamil# канала Dr. SRK Research Vision Tech
🧑🏫🔬 Welcome to Research Vision Tech 🔬👨💻
In this video, you will learn the step-by-step process of identifying crystal phases from X-ray Diffraction (XRD) data using X’Pert High Score software. Phase identification is one of the most essential steps in materials science, nanotechnology and solid-state chemistry, helping researchers confirm the purity and structure of synthesized materials.
📌 What you’ll learn in this tutorial:
👨💻Introduction to XRD and phase analysis
👨💻Importing XRD data into X’Pert High Score
👨💻Matching peaks with reference patterns (ICDD/PDF database)
👨💻Identifying phases and analyzing results
👨💻Tips for accurate and reliable phase identification
This video is perfect for research scholars, postgraduate students, and scientists working in nanomaterials, photocatalysis, ceramics, catalysts and composites who want to strengthen their data analysis skills.
If you have any inquiries, please feel free to ask via the comment section below. For more videos, kindly subscribe to my channel.
Thank you 🙏🙏
Email ID: srkchemist106@gmail.com
How to plot XRD data using the Origin software
https://youtu.be/Ww1AAsr9y2M
How to plot FTIR data using the Origin software
https://youtu.be/w7lqVG2yQvk
How to plot XRD data &JCPDS + hkl values using the Origin software
https://youtu.be/aLh-2P3xlS4
How to plot smoothing & baseline correction XRD data using the Origin software
https://youtu.be/Pm7tW96iDWs
How to Calculate XRD Particle Size using Scherrer’s Equation
https://youtu.be/MHkyw2_rrrc
How to plot multiple FTIR spectra in a single graph
https://youtu.be/bX_KkA9rTL8
How to Identify the XRD Phase using X’Pert High Score Software
https://youtu.be/CC8NLNQBYas
👉 Don’t forget to Like 👍 | Share 🔗 | Subscribe 🔔 for more research tutorials and scientific content!
Видео How to Identify the #XRD Phase for the #Prepared Sample using #X’Pert #High Score #Software#Tamil# канала Dr. SRK Research Vision Tech
Комментарии отсутствуют
Информация о видео
14 сентября 2025 г. 23:49:51
00:04:36
Другие видео канала