Traffic Light Chart in Excel - PM Dashboard ~ Part 2
Traffic Lights, Thermometer and Donut charts are efficient ways to communicate overall project status. In this tutorial, learn how to make these 3 powerful charts with simple steps using Excel.
This is part 2 of our Project Management Dashboard series.
Please check out Part 1 - https://www.youtube.com/watch?v=FXnyKU6xZeI
and the finale (Part 3) here 👉 https://youtu.be/Exlj5qH0rhc
💻👉Please download the files from here
==================================
https://chandoo.org/wp/interactive-project-dashboard-with-excel/#part2
⏱Video timestamps:
==================
0:00 - Introduction
0:48 - Traffic Light Chart
3:53 - Thermometer Chart
5:03 - Donut Progress Chart
💻👉Get ready to use Excel PM Templates:
====================================
https://chandoo.org/pmt/pmt-index-1.html
#TrafficLightChart #ProjectManagement
Видео Traffic Light Chart in Excel - PM Dashboard ~ Part 2 канала Chandoo
Показать
Комментарии отсутствуют
Информация о видео
Другие видео канала
 How to use Excel formula references - A1 vs. $A$1 vs $A1 vs A$1 explained
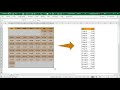 Awesome Power Query example - Calendar data to table format 📅➡📄
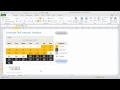 Employee Shift Tracker Excel Template - How it works
 Convert number to words with this Excel formula + LET Function Demo
 May the Power BI with you - Demo of Star Wars Infographic
 🧇 Yummy WAFFLE Chart in Power BI - How to make one?
 How to do weighted sorting in Excel?
 Celebrate Halloween with Creepy Spider Web Chart in Excel
 KNOW the difference between AVERAGE // MEDIAN // QUARTILES - Easy explanation 👌
 How to create a fully *INTERACTIVE* and AWESOME Dashboard in Excel (PART 2)
 How to split text values in Excel with formulas - Quick Solution ⏳
 Combine Excel Sheets with *this* simple formula
 DAX Concepts: How to Create Best in Category Calculations with Ease
 Where to get FREE Datasets to practice Data Analytics
 Average calculation in Excel, but with a twist 🥨
 Try this yummy Lollipop Chart 🍭 (Excel trick)
 Easiest Lookup formulas for any situation - an interview with Oz Du Soliel (Excel on Fire)
 Can you split The Hangover expenses using Excel?
 How to connect to Amazon AWS S3 Buckets from Power BI - Step by Step Tutorial (with code samples)
 6 Massively time saving Pivot Table tricks (Don't miss #4 & #6) ⏰
 Power BI Q&A - What is Microsoft Fabric? Tableau vs. Power BI, How important is SQL and more...