- Популярные видео
- Авто
- Видео-блоги
- ДТП, аварии
- Для маленьких
- Еда, напитки
- Животные
- Закон и право
- Знаменитости
- Игры
- Искусство
- Комедии
- Красота, мода
- Кулинария, рецепты
- Люди
- Мото
- Музыка
- Мультфильмы
- Наука, технологии
- Новости
- Образование
- Политика
- Праздники
- Приколы
- Природа
- Происшествия
- Путешествия
- Развлечения
- Ржач
- Семья
- Сериалы
- Спорт
- Стиль жизни
- ТВ передачи
- Танцы
- Технологии
- Товары
- Ужасы
- Фильмы
- Шоу-бизнес
- Юмор
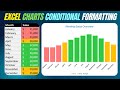
Creating an Interactive Timeline Line Chart in Excel with Milestone KPI Tracking
In this tutorial, we'll walk you through the process of creating a dynamic and interactive timeline line chart in both Excel and Google Sheets. We'll also show you how to incorporate Milestone KPIs (Key Performance Indicators) over time to effectively track and visualize your data. Whether you're a beginner or an experienced spreadsheet user, this video will provide step-by-step guidance on building a visually engaging chart for your data analysis needs. Learn to harness the power of Excel and Google Sheets for efficient data visualization, making your reports and presentations more impactful and insightful. Don't miss out on this opportunity to enhance your spreadsheet skills and impress your audience with your interactive timeline line chart with Milestone KPIs!
0:00 Introduction
0:16 Understanding the data
1:50 Inserting basic line chart
5:04 Making Milestone|Timeline vertical lines from dots
5:36 Displaying lable
6:50 Convert date to year on horizontal axies.
I hope you like the video please Subscribe to stay updated with more content like this! :)
File Link:
https://drive.google.com/uc?export=download&id=1XnhuREYYq-Q7eDZJ14JfWvSrQ931f_l3
Видео Creating an Interactive Timeline Line Chart in Excel with Milestone KPI Tracking канала ExBiSheets
Комментарии отсутствуют
Информация о видео
24 октября 2023 г. 21:50:38
00:07:17
Другие видео канала