Candle Stick Patterns
Candlestick pattern is a movement in prices of script shown graphically on the candlestick chart. By looking at this movement of prices over time period for particular script (candlestick pattern), anyone can predict the movement of the market. There are different 42 types of recognised candlestick patterns. But only few of them are well known.
Видео Candle Stick Patterns канала NSEData.com (Trader Guide)
Видео Candle Stick Patterns канала NSEData.com (Trader Guide)
Показать
Комментарии отсутствуют
Информация о видео
3 февраля 2016 г. 14:00:08
00:00:41
Другие видео канала
 NSEData.com will be Traderguide.in
 Scrip selection menu - NSEData.com
 How to use Query Builder to run your own query - NSEData.com
 How to start SmartTrader + ? - NSEData.com
 How to add or remove indicators on charts - NSEData.com
 Average true range - Technical Analysis Indicator
 GETTING STARTED WITH NSEData.com
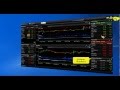 NSEData.com Introduction
 Overview of Smart investor Technical analysis tool - NSEData.com
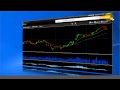 How to use Super trend to find buying and selling opportinities ?
 How to Use EMA Crossover to Find Buying and Selling Opportunities ?
 Set EOD Alerts for Your Favorite scripts to Get Email Alerts - NSEData.com
 Basic Info Menu Smart Investor - NSEData.com
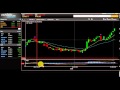 How to use MACD for Buying and selling opportunities - NSEData.com
 How to use Advance Info Menu - NSEData.com