Excel Monte Carlo Simulation
Excel Monte Carlo Simulation
An Excel Monte Carlo simulation creates future predictions by using probabilistic and random methods. Usually, around 10.000 simulations are run to achieve a reliable outcome.
Introduction to Monte Carlo simulation 0:00
Random dice rolls 0:33
Monte Carlo Simulation 1:15
Exact probability 3:41
Feel free to read the article in full:
https://softtechtutorials.com/microsoft-office/excel/monte-carlo-simulations/
As an example, we are going to create a sim like this with random dice rolls. We are going to roll three dice and examine the probability that the sum of the dice is 17 or higher and we are going to do this 10.000 times.
The second step in this Excel Monte Carlo simulation example is to produce numerous simulations of these three rolls.
We are going to change the value from rows to columns, you want a Linear series so we can leave this option like it is The step value is 1 and for Stop value we are going to enter 10.000.
The third and last step in this Excel monte carlo simulation is to verify the number of times the sum is above or equal to 17 and divide this by 10.000 to find the probability.
The range are the simulated numbers and the criterion is higher than or equal to 17 which we need to put in between quotes. We need to complete the calculation so I’m going to add divide by 10.000 after the brackets If we now hit enter, we receive a simulated value of 10.000 tries. This part has shown us how to use monte carlo simulation in Excel.
The probability we calculated earlier can be determined with simple math or trial and error.
To do so, we divide the number of satisfying combinations by the number of possible combinations. The number of satisfying combinations is 4 as listed in the left-hand table.
The number of possible outcomes for the sum of three dice is computed by 6 to the power 3 as we have 6 possible outcomes for each dice.
If we then divide the first number by the second, we see that the probability of having a sum above 17 is 1.85%, which is close to the outcome based on our monte carlo simulation.
This concludes our Excel Monte Carlo simulation tutorial. I'm inspired by content creators as Leila Gharani and Teacher's Tech.
#Excel #Tutorials #Statistics
Видео Excel Monte Carlo Simulation канала SoftTech Tutorials
Показать
Комментарии отсутствуют
Информация о видео
Другие видео канала
 Monte Carlo Technique: How to perform Business Simulations & Assess Projects Profitability | Excel
 6. Monte Carlo Simulation
 Monte Carlo Simulation For Any Model in Excel - A Step-by-Step Guide
 Monte Carlo Simulations: Run 10,000 Simulations At Once
 Monte Carlo Simulation
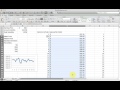 How to Simulate Stock Price Changes with Excel (Monte Carlo)
 Statistical Tolerancing using Monte Carlo Simulation
 R Beginner Monte Carlo Simulation
 Monte Carlo Simulation of Stock Price Movement
 MDM-U2.5-Monte Carlo Two Dice Simulation
 Most Useful Excel Keyboard Shortcuts
 Monte Carlo Simulation in Excel
 Monte Carlo Simulation in Excel: Financial Planning Example
 Monte Carlo Simulation Analysis
 Basic Monte Carlo Simulation of a Stock Portfolio in Excel
 Introduction to Monte Carlo Simulation in Excel 2016
 Basic Excel Business Analytics #66: Monte Carlo Simulation for New Product, 3 Uncertain Variables
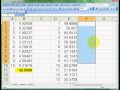 Using Excel's DataTable function for a basic simulation
 Building A Probabilistic Risk Estimate Using Monte Carlo Simulations
 Monte Carlo Simulations in Excel