GIS Tutorial: Simple Symbology Part I - ArcMap
This video introduces simple symbol manipulation of point, line and polygon features, and walks through the basics of setting up and saving custom symbols and labels. Also discusses the use and customization of the overview map. Lecture review tutorial videos from Hunter College and Mount Sinai School of Medicine (NYC) GIS in Public Health (PH 770.07), and (MPH-0005).
Видео GIS Tutorial: Simple Symbology Part I - ArcMap канала Chris Goranson
Видео GIS Tutorial: Simple Symbology Part I - ArcMap канала Chris Goranson
Показать
Комментарии отсутствуют
Информация о видео
Другие видео канала
 Understanding shapefiles in ArcMap: Tips and Tricks
 Data Visualization Tutorial: Visualizing Immigrant Owner Occupied Housing in New York City
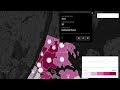 GIS Tutorial: Mapping Cockroaches and Asthma in NYC with CartoDB
 Hurricane Florence - help crowdsource social media photos and news for emergency responders
 ArcGIS Online Examples
 How to make a National Geographic style map with near real-time forest fire data using Felt / AGOL.
 CartoDB Web Map Tutorial: Tracking Case Reports from the Virtual Epidemic using GIS
 Data Visualization Tutorial: Google Fusion Tables and NYC Open Data
 Data Visualization Tutorial: Mapping and Data Visualization of U.S. Migration Flows
 Data Visualization Project Intro: Working with the Google / PRIO Small Arms and Ammo Data Viz
 How to make a map with Excel (ArcGIS for Excel add-in)
 Getting Census data in ArcMap using table joins
 Animation of tweets during Superstorm Sandy in New York City using ArcGIS 10 and Tracking Analyst
 How to geocode data in ArcMap using the New York City LION geocoder.
 How to make a basemap for ArcGIS.
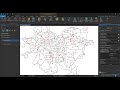 How to use the spatial join tool in ArcGIS Pro.
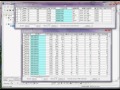 Join tables in ArcMap using U.S. Census data - CSV, DBF, or Excel
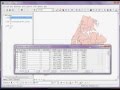 GIS Tutorial: How to perform a spatial join in ArcMap
 GIS Tutorial: How to add a map inset in ArcMap
 Easy D3 Data Visualizations using Raw: Visualizing Student Debt by State and Year