How to take heap dump and Rread, analyze heap dump file by free software VisualVM | .hprof file
#Take #HeapDump #Analyze #HeapdumpFile
Take HeapDump and Analyze the file by VmVisual ► SUBSCRIBE & LIKE!!
► Official Email Id: techtalk.debu@gmail.com
► Download the Code GitHub : https://github.com/admindebu
► Follow on Facebook: https://www.facebook.com/TechTalkDebu
► Follow on LinkedIn: https://www.linkedin.com/in/debu-paul
~~~~~~~~~~~~~~~~~~~~~~~~~~~~~~~~~~~~~~~~~~~~~~~~~~~~~~~~~~~~~~~~~~~~~~~~~~~~~~~~~~~~~~
► Here is our amazing playlist for Core Java, Spring MVC/Boot, Git and Micro service
~~~~~~~~~~~~~~~~~~~~~~~~~~~~~~~~~~~~~~~~~~~~~~~~~~~~~~~~~~~~~~~~~~~~~~~~~~~~~~~~~~~~~~
1. Core Java :: https://www.youtube.com/watch?v=IR_h0okI_eU&list=PLRlT3yKdok6o5pLrr74SdpRI0ZV-KbGOl
2. Spring MVC & Spring Boot :: https://www.youtube.com/watch?v=f-Wk1t8Cfio&list=PLRlT3yKdok6rFd0_O6-lpuIrNwFgxP_b8
3. Micro Service :: https://www.youtube.com/watch?v=pscyaLdGtnI&list=PLRlT3yKdok6r_6j4Y0R75TP4WiiaT21K7
4. Git/GitHub :: https://www.youtube.com/watch?v=XHxBAyEnl4E&list=PLRlT3yKdok6ojVpar7ImPHZ6JbSy6Lnj7
~~~~~~~~~~~~~~~~~~~~~~~~~~~~~~~~~~~~
Watch my "Most Watched Videos"
~~~~~~~~~~~~~~~~~~~~~~~~~~~~~~~~~~~~
► HTTPS & HTTPS protocol :: https://www.youtube.com/watch?v=BlnSSD0Vw98&list=PLRlT3yKdok6ovZ3BGGM3eanawiNUOcrWz
Playlist : https://www.youtube.com/watch?v=CFoxrsEdo-w&list=PLRlT3yKdok6pLwhX58LwNBcsqGl_K206b Tutorial for beginners with examples, Interview Questions and Concepts.
~~~~~~~~~~~~~~~~~~~~~~~~~~~~~~~~~~~~
Code Base & Info
~~~~~~~~~~~~~~~~~~~~~~~~~~~~~~~~~~~~
heap dump whenever an OutOfMemoryError occurs.
The -XX:+HeapDumpOnOutOfMemoryError option can be added to generate a heap dump on OutOfMemoryError. By default, the heap dump is created in a file called java_pid pid .hprof in the working directory of the VM, but we can set an alternative path using the JVM option -XX:HeapDumpPath=path.
Using a jmap & jcmd tool available with JDK
Find Java process ID
1. Windows Task Manager
2. Linux Below command
ps –ef | grep java
jmap -dump:live,format=b,file=heap.bin "pid"
heap dump file extension : .hprof
jmap -dump:live,format=b,file=heap.bin "pid"
"pid" can be replaced with the process id of the application.
Example : jmap -dump:live,format=b,file=C:\heapDump\heapDUmp.hprof 6336
Doanload link for VisualVm Application : https://visualvm.github.io/download.html
Видео How to take heap dump and Rread, analyze heap dump file by free software VisualVM | .hprof file канала TechTalk Debu
Показать
Комментарии отсутствуют
Информация о видео
Другие видео канала
 Debug JVM using JVisual VM | Heap Dump | Thread Dump | Profiling | Tech Primers
 Gal Ben Ami - Auto-Mat: Pipeline for Java Heap Dump Analysis
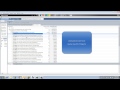 JVM Heap Dump Analysis - OpenJPA memory leak
 How to make stress your friend | Kelly McGonigal
 Dynatrace Quick Demo - Solving a memory leak problem
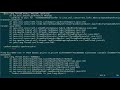 Easy way to get multiple Java Thread Dumps using 'jstack'
 Understanding JVM Memory, Heap, Garbage Collection and Monitoring the JVM | Tech Primers
 Create your own portfolio management responsive webpage in Gihub.io | Free of cost host your Website
 Solving Java Memory Leaks
 Everything I Ever Learned About JVM Performance Tuning at Twitter (Attila Szegedi, Hungary)
 ★ How to Get to Mars. Very Cool! HD
 Heap and thread dumps creation and analysis using JVisualVM
 Java Heap Dump Analysis - VisualVM Tutorial
 IBM Websphere Application Server Thread Dump and Analyze
 Thread Dump Analysis Fundamentals - Part 1
 How To Increase Heap Size in JMeter | HOW TO in JMeter Series | Perfology 2020
 VisualVM Tutorial
 java.lang.OutOfMemoryError: Java heap space
 How to change Volume Style Bar in Vivo Y11_Latest Hidden Feature Vivo||Secret Setting Vivo||#2020😱🔥
 jmap and jhat