Simple LBO Model - Case Study and Tutorial
In this LBO Model tutorial, you'll learn how to build a very simple LBO model "on paper" that you can use to answer quick questions in PE (and other) interviews.
By http://breakingintowallstreet.com/ "Financial Modeling Training And Career Resources For Aspiring Investment Bankers"
This matters because in many cases, they'll ask you to calculate numbers such as IRR and multiple of invested capital very quickly and will not actually ask you to build a more complex model until later in the process.
You should always START this exercise by looking at the actual question or set of questions they are asking you:
"Calculate the purchase price required for ABC Capital to obtain a 3.0x multiple of invested capital (MOIC) if it plans to sell OpCo after five years at an EV / EBITDA multiple of 6.0x."
So they're giving you the exit multiple and the return on investment that the PE firm is targeting, and you have to figure out the initial purchase price by "working backwards."
Here's how we interpret each line in this case study and use it in the model:
"OpCo currently has EBITDA of $250mm, and ABC believes that the new management team could keep EBITDA flat for the next 5 years."
This tells you to make the initial EBITDA $250mm and keep it at that level for 5 years - skip revenue, COGS, OpEx, and everything else because none of that matters if this is all they give you.
"ABC Capital has obtained debt financing of $750mm at 10% interest, and OpCo expects working capital to be a source of funds at $6mm per year."
The initial debt balance is $750mm and there's a 10% interest rate, so the interest expense will be $75mm per year.
In the "Cash Flow Statement Adjustments", since Working Capital is a SOURCE of funds it will add $6mm to cash flow each year.
"OpCo requires capital expenditures of $35mm per year, and it has a tax rate of 40%. Assume no transaction fees, zero minimum cash required, and that PP&E on the balance sheet remains constant for the next 5 years."
Also in the CFS section, CapEx = $35mm per year, and Depreciation also equals $35mm per year since the PP&E balance does not change at all. So you can also fill in the Depreciation figure on the Income Statement.
No transaction fees and no minimum cash requirement simplify the purchase price and debt repayment - although we don't even have debt repayment here.
"Assume that excess cash is NOT used to repay debt, and instead simply accumulates on the Balance Sheet."
This makes the final numbers easier to calculate, since interest expense will never change and you can simply add up cash generated to get to the final cash number at the end.
PROCESS:
1. Start with the Income Statement - EBITDA is $250mm per year.
Subtract Depreciation of $35mm per year, and interest of $75mm per year.
So EBIT = $140mm. Taxes = $140mm * 40%, so Net Income = $140mm - $56mm = $84mm.
2. On the simplified CFS, Net Income = $84mm, Depreciation = $35mm, Change in Working Capital = $6mm, CapEx = ($35mm), so Cash Generated per year = $90mm.
3. EBITDA Exit Multiple = 6.0x, and final year EBITDA = $250mm, so Exit EV = $1.5B.
Subtract the outstanding debt of $750mm and add the cash generated in this period of $450mm, so Equity Proceeds = $1.2B.
4. Targeted MOIC = 3.0x so the PE firm would have to invest $400mm in the beginning.
$400mm equity + $750mm debt = $1.150B, so the purchase multiple is $1,150 / $250 = 4.6x.
Further Resources
http://youtube-breakingintowallstreet-com.s3.amazonaws.com/109-04-Simple-LBO-Model.pdf
http://youtube-breakingintowallstreet-com.s3.amazonaws.com/109-04-Simple-LBO-Model.xlsx
Видео Simple LBO Model - Case Study and Tutorial канала Mergers & Inquisitions / Breaking Into Wall Street
Показать
Комментарии отсутствуют
Информация о видео
17 июня 2014 г. 8:19:30
00:13:25
Другие видео канала
 LBO Model Interview Questions: What to Expect
 LBO Model Case Study: Assessment Center
 Henry Kravis: How the Corporate Titan Rocked Wall Street
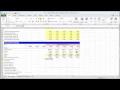 Financial Modeling Quick Lesson: Building a Discounted Cash Flow (DCF) Model - Part 1
 Private Equity: The Consolidation Play and Due Diligence - John Poerink, Linley Capital
 Excel Crash Course for Finance Professionals - FREE | Corporate Finance Institute
 How to work a Leveraged Buy Out or LBO - How to Buy a Business - David C Barnett
 Enterprise Value: Why You Add and Subtract Items
 Private Company Valuation
 Learn With DFIC: Paper Pen LBO
 Simple LBO
 Basic leveraged buyout (LBO) | Stocks and bonds | Finance & Capital Markets | Khan Academy
 Merger Model Interview Questions: What to Expect
 Interview Answer - What Is A Leverage Buy Out (LBO)
 LBO Model: Sources & Uses
 LBO Exit Strategies: M&A, IPOs, and Dividends / Recapitalizations
 Financial Modeling Quick Lesson: Simple LBO Model (1 of 3)
 Purchase Price Allocation in an LBO Model
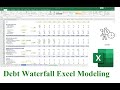 How to Model a Debt Waterfall (Debt Schedule) - Investment Banking Financial Modeling Skills
 Private Equity Interview Questions and Answers