- Популярные видео
- Авто
- Видео-блоги
- ДТП, аварии
- Для маленьких
- Еда, напитки
- Животные
- Закон и право
- Знаменитости
- Игры
- Искусство
- Комедии
- Красота, мода
- Кулинария, рецепты
- Люди
- Мото
- Музыка
- Мультфильмы
- Наука, технологии
- Новости
- Образование
- Политика
- Праздники
- Приколы
- Природа
- Происшествия
- Путешествия
- Развлечения
- Ржач
- Семья
- Сериалы
- Спорт
- Стиль жизни
- ТВ передачи
- Танцы
- Технологии
- Товары
- Ужасы
- Фильмы
- Шоу-бизнес
- Юмор
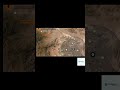
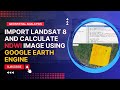
Mapping Carbon Monoxide (CO) Using Sentinel-5P in Google Earth Engine | Step-by-Step GIS Tutorial
Learn how to map Carbon Monoxide (CO) air pollution using Sentinel-5P satellite data in Google Earth Engine (GEE) with a clear, step-by-step workflow.
#Sentinel5P #googleearthengine #airpollution
#carbonmonoxide #arcgis #gis
#RemoteSensing
#EnvironmentalAnalysis
In this tutorial, you will:
Define a study area using administrative boundaries
Load Sentinel-5P OFFL Level-3 Carbon Monoxide data
Compute the annual mean CO column density
Extract the real minimum and maximum CO values
Visualize CO using data-driven min–max scaling
Add a professional map legend
Export the final CO pollution map to Google Drive
This video follows the exact Google Earth Engine code workflow, making it ideal for:
GIS students, remote sensing researchers, environmental scientists, and anyone working on air quality analysis using satellite data.
📌 Dataset Used
Sentinel-5P (COPERNICUS/S5P/OFFL/L3_CO)
Variable: CO_column_number_density (mol/m²)
📌 Tools
Google Earth Engine
JavaScript API
💬 Comment below: Which country or city should we analyze next using Sentinel-5P?
👍 Like | 🔔 Subscribe | 💬 Comment
for more GIS, Remote Sensing & Google Earth Engine tutorials.
Видео Mapping Carbon Monoxide (CO) Using Sentinel-5P in Google Earth Engine | Step-by-Step GIS Tutorial канала Geospatial Analysis
sentinel 5p carbon monoxide mapping co pollution satellite google earth engine tutorial gee air pollution sentinel 5p co air quality mapping gis remote sensing air pollution co column number density google earth engine sentinel 5p satellite air quality analysis environmental gis atmospheric pollution mapping sentinel 5p tutorial gis pollution mapping earth engine air quality co pollution map copernicus sentinel 5p gee environmental analysis
Комментарии отсутствуют
Информация о видео
14 января 2026 г. 18:08:41
00:06:40
Другие видео канала