ggplot: A Grammar of Graphics for the Wolfram Language
This presentation features Andrew Yule discussing a new open-source project called ggplot that aims to create a Wolfram Language package giving similar functionality to R's ggplot. The background on ggplot is presented, along with the current status of the Wolfram Language package and future involvement.
ggplot is a package for the R programming language, which is part of the larger "tidyverse" ecosystem. The fundamental idea of ggplot is that graphics can be built up through various lower-level "layers." While the graphics framework in the Wolfram Language is very robust and comprehensive, plots are generally created through higher-level functions like Plot, ListPlot, etc. These functions are great for simple plotting, but when the desire to control more of the aesthetics is needed, they can be difficult to work with.
Видео ggplot: A Grammar of Graphics for the Wolfram Language канала Wolfram
Показать
Комментарии отсутствуют
Информация о видео
Другие видео канала
 ggplot2 Scales and Transformations - Data Communication / Data Visualization
 ggplot2 workshop part 1
 Guide to ggplot Colors: Working with Color Gradients for Numeric Data
 Deep Learning with the Wolfram Language
 Mathematica Experts Live: Visualization Q&A 2012
 Plotting Locations - Wolfram Language for GIS Programming (1)
 W4: The Grammar of Graphics and its use in ggplot2
 An Introduction to Mathematica and the Wolfram Language for Engineers
 Informal History of Physics
 Learn how to do Data Visualization in Mathematica with Farid Pasha (Part -1)
 Wolfram Physics Project Launch
 Stephen Wolfram: The Background and Vision of Mathematica
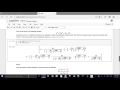 Symbolic Manipulation in Python
![Wolfram Physics Project: Working Session Aug 18, 2020 [Physicalization of Empirical Metamathematics]](https://i.ytimg.com/vi/X1qkJMTwKAw/default.jpg) Wolfram Physics Project: Working Session Aug 18, 2020 [Physicalization of Empirical Metamathematics]
Wolfram Physics Project: Working Session Aug 18, 2020 [Physicalization of Empirical Metamathematics] Mathematica vs. R–Advanced Use Cases
 Introduction to Mathematica, Wolfram language and Wolfram Cloud
 Bjarne Stroustrup: The 5 Programming Languages You Need to Know | Big Think
![[R Beginners] Line chart using GGPLOT in R.Single and multiple line charts, with code](https://i.ytimg.com/vi/y96uJAlTwNY/default.jpg) [R Beginners] Line chart using GGPLOT in R.Single and multiple line charts, with code
[R Beginners] Line chart using GGPLOT in R.Single and multiple line charts, with code Computational Thinking with the Wolfram Language