- Популярные видео
- Авто
- Видео-блоги
- ДТП, аварии
- Для маленьких
- Еда, напитки
- Животные
- Закон и право
- Знаменитости
- Игры
- Искусство
- Комедии
- Красота, мода
- Кулинария, рецепты
- Люди
- Мото
- Музыка
- Мультфильмы
- Наука, технологии
- Новости
- Образование
- Политика
- Праздники
- Приколы
- Природа
- Происшествия
- Путешествия
- Развлечения
- Ржач
- Семья
- Сериалы
- Спорт
- Стиль жизни
- ТВ передачи
- Танцы
- Технологии
- Товары
- Ужасы
- Фильмы
- Шоу-бизнес
- Юмор
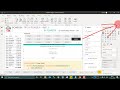
The Hidden KQL Tricks Data Analysts Need in 2025 | Storm Data Analysis Made Simple | Taik 18
Stop writing bad KQL and simplify your storm data analysis with this step-by-step tutorial. Learn how to effectively query and explore insights from large datasets using Kusto Query Language (KQL). In this video, we'll walk you through a real-world scenario of analyzing storm events across the United States.
You'll discover how to:
• Identify states with the most storm events
• Calculate total damage caused by storms in specific regions
• Determine when the most damaging storms occurred
We'll demonstrate practical KQL techniques, including using the 'where' clause for filtering and the 'project' operator for selecting specific columns. Whether you're a data professional or a beginner looking to enhance your skills, this tutorial will help you streamline your process and gain valuable insights from your data.
Improve your data analytics skills and learn how to leverage KQL for real-time intelligence. Subscribe to our channel for more Power BI, Power Automate, and Azure DevOps tutorials that will take your data analysis to the next level.
🎥 Check out our full KQL playlist: https://www.youtube.com/playlist?list=PLBGVH95YWOV3-Odhui9VifYVQyZRKBqsK
🔔 Don’t forget to Subscribe for more videos
#kql #kustotutorial #azuredataexplorer #kustoquerylanguage #wildfires
CHAPTERS:
00:00 - Analyzing Storm Data
00:05 - Scenario 1 - Storm Data Analysis
Видео The Hidden KQL Tricks Data Analysts Need in 2025 | Storm Data Analysis Made Simple | Taik 18 канала taik18 - Mohammed Adnan
tornado storm sewer kql azure data explorer storm event weather phenomena hurricane flash flood climate weather review kusto query language natural disasters climate change microsoft azure severe storm kusto tutorial weather events data science storm data flood extreme weather wildfires weather forecast heavy rain severe weather real-time processing thunderstorm environment kql analysis what is azure data explorer
Комментарии отсутствуют
Информация о видео
7 ноября 2024 г. 6:30:03
00:02:57
Другие видео канала