- Популярные видео
- Авто
- Видео-блоги
- ДТП, аварии
- Для маленьких
- Еда, напитки
- Животные
- Закон и право
- Знаменитости
- Игры
- Искусство
- Комедии
- Красота, мода
- Кулинария, рецепты
- Люди
- Мото
- Музыка
- Мультфильмы
- Наука, технологии
- Новости
- Образование
- Политика
- Праздники
- Приколы
- Природа
- Происшествия
- Путешествия
- Развлечения
- Ржач
- Семья
- Сериалы
- Спорт
- Стиль жизни
- ТВ передачи
- Танцы
- Технологии
- Товары
- Ужасы
- Фильмы
- Шоу-бизнес
- Юмор
GGN -DSAI- Power BI | Session : 5
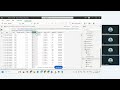
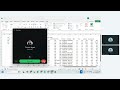
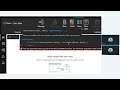
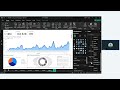
Learn Power BI Tables, Slicers, DAX Formulas, Conditional Formatting, Sparklines, and Dashboard Designing in this complete Hindi tutorial. In this session, you will understand how to create professional Power BI reports using tables, cards, slicers, filters, DAX measures, formatting techniques, yearly trends, and interactive dashboards.
Topics Covered:
• Power BI Table Visual Formatting
• DAX Formulas & Measures
• SUM, AVERAGE, MAX, MIN Functions
• Filter Context Explained
• Conditional Formatting in Power BI
• Icons, Data Bars & Color Formatting
• Sparklines & Yearly Trends
• Slicers & Cross Filtering
• Dashboard Design Tips
• Professional Report Formatting
• Interactive Power BI Dashboard Creation
This tutorial is perfect for beginners and intermediate Power BI learners who want to improve their dashboard designing and DAX skills.
#PowerBI #DAX #PowerBITutorial #DashboardDesign #DataAnalytics #BusinessIntelligence #PowerBIDashboard #DataVisualization #MicrosoftPowerBI #PowerBIHindi #DAXFormula #ConditionalFormatting #PowerBITips #DataAnalysis #ExcelToPowerBI #BIReporting #PowerBITraining #LearnPowerBI #PowerBIForBeginners #Analytics
Видео GGN -DSAI- Power BI | Session : 5 канала Palin Analytics
Комментарии отсутствуют
Информация о видео
12 мая 2026 г. 13:35:03
01:40:48
Другие видео канала