- Популярные видео
- Авто
- Видео-блоги
- ДТП, аварии
- Для маленьких
- Еда, напитки
- Животные
- Закон и право
- Знаменитости
- Игры
- Искусство
- Комедии
- Красота, мода
- Кулинария, рецепты
- Люди
- Мото
- Музыка
- Мультфильмы
- Наука, технологии
- Новости
- Образование
- Политика
- Праздники
- Приколы
- Природа
- Происшествия
- Путешествия
- Развлечения
- Ржач
- Семья
- Сериалы
- Спорт
- Стиль жизни
- ТВ передачи
- Танцы
- Технологии
- Товары
- Ужасы
- Фильмы
- Шоу-бизнес
- Юмор
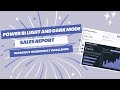
Build an Executive Customer Churn Dashboard in Power BI | End-to-End Project
In this live session, we’ll build a complete executive-style Customer Churn Analytics Dashboard in Power BI from start to finish.
Using a fictional telecom company dataset, we’ll analyze customer churn patterns, identify high-risk customers, and design a dashboard focused on business storytelling and decision-making.
What we’ll cover:
✅ Data modeling
✅ DAX calculations
✅ Dynamic KPI comparisons
✅ Churn rate analysis
✅ Revenue loss tracking
✅ Risk segmentation
✅ Customer prioritization logic
✅ Dashboard design & layout
✅ Executive storytelling in Power BI
By the end of the session, you’ll understand how to build a real-world dashboard that answers key business questions like:
• Who is churning?
• Why are they churning?
• How much revenue is being lost?
• Which customers should retention teams prioritize?
This session is perfect for:
📌 Aspiring Data Analysts
📌 Power BI Beginners & Intermediate Users
📌 Portfolio Builders
📌 Anyone interested in business-focused dashboard design
Tools:
🛠 Power BI
🛠 DAX
🛠 Data Modeling
Make sure to join live and come with your questions!
📂 Resources for the class:
https://drive.google.com/drive/folders/16O054Nx9O7saUZ96intL1auobUmKw1Bd?usp=sharing
Get the complete PBIX file here:
nestuge.com/atbg6dr2c
Register for the Data Portfolio Masterclass here:
nestuge.com/dataproject
#PowerBI #DataAnalytics #DAX #CustomerChurn #BusinessIntelligence #DashboardDesign #DataStorytelling
Видео Build an Executive Customer Churn Dashboard in Power BI | End-to-End Project канала Tina Okonkwo
Комментарии отсутствуют
Информация о видео
12 ч. 25 мин. назад
02:06:35
Другие видео канала