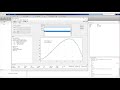
Formation MATLAB | 6- les graphes 2D
Script MATLAB : https://bit.ly/Script_Matlab2D
les commandes : fplot, plot, stem, inline, eval, feval, fzero,figure, title, xlabel, ylabel, gtext, text, axis, grid, hold on, hold off, subplot, print, loglog ...
Видео Formation MATLAB | 6- les graphes 2D канала SupStudy
les commandes : fplot, plot, stem, inline, eval, feval, fzero,figure, title, xlabel, ylabel, gtext, text, axis, grid, hold on, hold off, subplot, print, loglog ...
Видео Formation MATLAB | 6- les graphes 2D канала SupStudy
Показать
Комментарии отсутствуют
Информация о видео
Другие видео канала
 Curve Fitting with CFTOOL - MATLAB for Non-Believers
 💻 MATLAB TUTORIAL || How to plot multiple plot using "subplot(m,n,p)" command?
 Formation MATLAB | 5- Les polynômes sous MATLAB
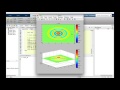 Lab12_2: Wave Equation 2D
 Read and Display an Image in Matlab | image processing
 How to Generate a Figure with Two Y-axes in MATLAB
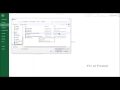 39 - Importer des données d'un fichier txt ou csv
 Création de graphique avec Excel (version 2016)
 Méthode de Newton-Raphson détaillée et programmée sous Matlab
 5.4.3-Curve Fitting: Worked Example 3--with Matlab
 2.3 - OFDM/ OFDMA IN 4G LTE - PART 1
 MatLab corrigé de l'examen
 Importing and plotting experimental data in matlab
 Matlab - Bode, marges de gain et de phase
 MATLAB meshgrid, surf, and mesh 3D plotting
 Matlab ,Types de données et variables, EXERCICE 7 :
 Théorie des distributions | Partie 1 | Analyse 4
 Formation MATLAB | 2- Syntaxe de base - Variables - Fonctions - Tableaux - Matrices
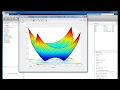 Plotting Complex Functions - Matlab for Non-Believers
 Initiation MATLAB- 5- SIMULINK