Probability with the standard normal table (P(0 to z))
How to use the standard normal table with probabilities between the mean and positive z values. 8 examples shown, see description for hyperlinked table of contents.
Corrections:
1. @1:40, 'the first 2 decimals' should be 'the first 2 digits'. 'The 3rd decimal' should be 'the 3rd digit.'
2. @7:42 the area between 1.08 and 2.45 = .133.
Table of Contents:
1:14 - How to read the table and find z
3:17 - Probability of z between 0 and 1
4:20 - Probability of z greater than 1
6:05 - Probability of z between 1.08 and 2.45
7:52 - Probability of z less than 1.67
9:00 - Probability of z between -1 and 0
10:13 - Probability of z less than -1.96
11:36 - Probability of z between -2.75 and -0.5
13:11 - Probability of z between -2.18 and 1.96
Видео Probability with the standard normal table (P(0 to z)) канала Quant Quill
Показать
Комментарии отсутствуют
Информация о видео
Другие видео канала
 Stats: Finding Probability Using a Normal Distribution Table
 Finding Areas Using the Standard Normal Table (for tables that give the area between 0 and z)
 03 - The Normal Probability Distribution
 How To Find The Z Score Given The Confidence Level of a Normal Distribution 2
 Standardizing Normally Distributed Random Variables
 Normal Distribution Word Problems
 Finding Areas Using the Standard Normal Table (for tables that give the area to left of z)
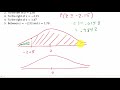 Finding Area Under A Curve Using Z Scores
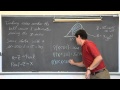 z-score Calculations & Percentiles in a Normal Distribution
 finding x-values for a normal distribution
 Z-Scores, Standardization, and the Standard Normal Distribution (5.3)
 IDENTIFYING REGIONS UNDER NORMAL CURVE CORRESPONDS TO DIFFERENT STANDARD NORMAL VALUES
 Standard Normal Distribution Tables, Z Scores, Probability & Empirical Rule - Stats
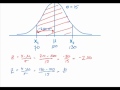 Normal Distribution & Z-scores
 Standard Scores (Z-Scores) Part 1: Solving for Z-Scores Explained in Tagalog!!!
 How To Find The Z Score, Confidence Interval, and Margin of Error for a Population Mean
 The Normal Distribution and the 68-95-99.7 Rule (5.2)
 COMPUTING PROBABILITIES USING THE STANDARD NORMAL TABLE || GRADE 11 STATISTICS AND PROBABILITY Q3
 Finding Percentiles for a Normal Distribution
 Finding Areas Under the Standard Normal Distribution Curve