Data Visualization at the Census Bureau
This section provides an introduction to the work of the U.S. Census Bureau’s data visualization team and an overview of how data visualizations represent census data. Student hosts are joined by Gerson Vasquez and Viviana Garcia, members of the data visualization team.
Видео Data Visualization at the Census Bureau канала U.S. Census Bureau
Видео Data Visualization at the Census Bureau канала U.S. Census Bureau
Показать
Комментарии отсутствуют
Информация о видео
Другие видео канала
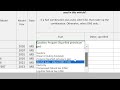 Using the Spreadsheet to Report for 3 or More Vehicles for the Vehicle Inventory and Use Survey
 Module 2 - A Stroke of Genealogy: Census Schedules and Records
 We Count: 2015 Census Test
 May Is Asian American and Pacific Islander Heritage Month
 Sea Censista (Los beneficios)
 Using the American Community Survey Summary File
 Tennis Player CoCo Vandeweghe Wants You to be Counted in the 2020 Census
 Economic Data From the US Census Bureau
 How to Access, Map, & Compare Detailed Veteran Data on Income, Housing, Employment, Business & More
 Your Community by the Numbers: Ancestry and Foreign Born Populations
 Census Business Builder, Regional Analyst Edition 2.0 - Overview
 Aly Badra Kaba, Director of the Mayor's Office on African Affairs, Washington, D.C.
 Creating Customized Tables Microdata Access Tool in data census gov
 How to Find Which Surveys Have the Data You Need
 Three-time Grammy Award Winner Jon Secada on Statistics in Schools
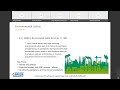 Using Census Tools for Environmental Justice
 TV Show Hosts, Entrepreneurs, & DJs Coco and Breezy Support the 2020 Census
 Sierra’s Test Census Story
 2021 Annual Business Survey: Economic and demographic characteristics for employer firms and...
 TOP Summit 2023 - Day 1