- Популярные видео
- Авто
- Видео-блоги
- ДТП, аварии
- Для маленьких
- Еда, напитки
- Животные
- Закон и право
- Знаменитости
- Игры
- Искусство
- Комедии
- Красота, мода
- Кулинария, рецепты
- Люди
- Мото
- Музыка
- Мультфильмы
- Наука, технологии
- Новости
- Образование
- Политика
- Праздники
- Приколы
- Природа
- Происшествия
- Путешествия
- Развлечения
- Ржач
- Семья
- Сериалы
- Спорт
- Стиль жизни
- ТВ передачи
- Танцы
- Технологии
- Товары
- Ужасы
- Фильмы
- Шоу-бизнес
- Юмор
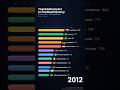
🌍 GDP by Country (1900–2026) 📈 | Animated Race Chart History
🌍 **How has the global economy changed over the last 126 years?**
Travel through more than a century of economic history in this animated **GDP Race Chart**, showing how countries have risen and fallen in global economic rankings from **1900 to 2026**.
Watch the world's largest economies compete as industrialization, world wars, technological revolutions, globalization, and modern innovation reshape the global balance of economic power.
## 🌎 Featured Countries
🇺🇸 United States
🇨🇳 China
🇩🇪 Germany
🇯🇵 Japan
🇮🇳 India
🇬🇧 United Kingdom
🇫🇷 France
🇮🇹 Italy
🇧🇷 Brazil
🇨🇦 Canada
...and many more!
## 📊 What You'll See
📈 Animated GDP Race Chart
🌍 Global Economic Rankings
🏭 Industrial & Technological Growth
📅 Historical Timeline (1900–2026)
📊 Beautiful Data Visualization
🏛️ Vintage Documentary Style
This visualization highlights how the world's economic leaders changed through major historical events including the Industrial Revolution, the Great Depression, World Wars, globalization, the digital revolution, and the rise of emerging economies.
Whether you're interested in economics, finance, geography, history, or data visualization, this video offers a fascinating journey through over a century of global economic transformation.
👍 If you enjoy animated race charts and historical statistics, don't forget to **Like**, **Subscribe**, and **Turn on Notifications** for more videos!
Видео 🌍 GDP by Country (1900–2026) 📈 | Animated Race Chart History канала The DataStreet Times
the Great Depression World Wars finance geography GDP by country global GDP GDP ranking largest economies world economy economic history economy countries by GDP GDP race race chart data visualization historical GDP world rankings economic growth macroeconomics statistics historical rankings top economies China GDP United States GDP India GDP Japan GDP Germany GDP United Kingdom GDP France GDP Italy GDP Brazil GDP Canada GDP
Комментарии отсутствуют
Информация о видео
6 ч. 31 мин. назад
00:03:00
Другие видео канала