Lineweaver Burk plot
A typical curve of enzyme kinetics is a plot of a plot of velocity of reaction vs substrate concentration. As the substrate concentration increases the velocity of the reaction increases until it reaches a plateau, which is known as maximum reaction velocity or Vmax. The drawback of this graph is that the plateau region is not perfectly horizontal. Beacuse of this there is a error in the estimation of Vmax and Km. Hence the researchers started modifying the graphs to get better estimate of Vmax and Km. One of such graph is lineweaver burk plot.
Видео Lineweaver Burk plot канала Quick Biochemistry Basics
Видео Lineweaver Burk plot канала Quick Biochemistry Basics
Показать
Комментарии отсутствуют
Информация о видео
Другие видео канала
 Lineweaver-Burk Plot and Reversible Inhibition
 USMLE Step 1 Basic Pharmacology: Enzymes
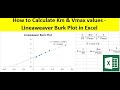 How to calculate Km and Vmax values - Lineweaver Burk plot in Excel
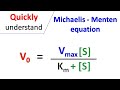 Michaelis Menten equation
 How to calculate Vmax and Km from a Lineweaver-Burk plot
![Enzyme Kinetics with Michaelis-Menten Curve | V, [s], Vmax, and Km Relationships](https://i.ytimg.com/vi/kmyR1cYxRL4/default.jpg) Enzyme Kinetics with Michaelis-Menten Curve | V, [s], Vmax, and Km Relationships
Enzyme Kinetics with Michaelis-Menten Curve | V, [s], Vmax, and Km Relationships Memorize Enzyme Inhibition
 An introduction to enzyme kinetics | Chemical Processes | MCAT | Khan Academy
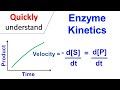 Enzyme kinetics
 Enzyme Kinetics Part 4 (Lineweaver Burk Plot)
 Biochemistry | Michaelis Menten & Lineweaver-Burk Plot
 Enzyme Kinetics (Km and Vmax) - Part 1
 Types of Enzyme Inhibition: Competitive vs Noncompetitive | Michaelis-Menten Kinetics
 Lineweaver Burk Plot Tutorial (W/ multiple inhibitors)
 Lineweaver Burk plot data analysis
 Das Lineweaver Burk Diagramm - Lineweaver Burk Gleichung
 Eadie Hofstee Plot
 Double reciprocal plot for competetive inhibition
 Lineweaver-Burk Plot