Relative Strength Index Calculation #shorts #krinu #relativestrengthindex #stockmarketindicator
RSI Relative strength index is an oscillator for a specific stock or index or any security , usually its calculated for the previous 14 trading days to build the chart
to get the initial values we need t first calculate the RS relative strength and build on subsequent 14 days period with the previous averages we have got to plot the graph
RSI oscillates between 0 - 100 % .
Usually its considered to be over bought when RSI crosses 70% and considered over sold when it crosses below 30% mark
RSI is an effective early indicator which measures the stregth of the asset in trading but RSI may not work precisely in a trending market which is driven by NEWS , key Events etc , in these cases the asset may be in the over Sold or Over bought levels for a longer period of time , so experienced traders use RSI in combination with other Moving averages to make well informed decesions in trading , one such can be using RSI with the Volumes data to ensure the momentum is strong or weak .
Join this channel to get access to perks:
https://www.youtube.com/channel/UCLlvV6YwZnF6wLGBQuOyTcg/join
Видео Relative Strength Index Calculation #shorts #krinu #relativestrengthindex #stockmarketindicator канала Krinu
Показать
Комментарии отсутствуют
Информация о видео
Другие видео канала
 How to cook Pudina or Mint - Chicken Chops
 Call Ratio Back Spread strategy in options trading - Stock market technical analysis #shorts #krinu
 What is Metaverse -Virtual reality - Augmented reality
 Hanging man pattern in Bearish reversal candle stick pattern - Technical analysis #shorts #krinu
 what is Cloud Computing - Client Server Model - IaaS PaaS SaaS explained
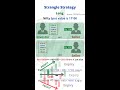 Long Strangle options strategy in Stock market technical analysis #shorts #krinu
 Rava fish fry - Semolina sooji fish fry
 How to cook Kancheepuram idli - Steamed Idli in Banana leaf
 What is Open Interest OI in Futures and Options - Stock market #shorts #short #krinu
 How to cook Tirunelveli Sodhi kolambu - Coconut milk Sodhi
 How to Cook Prawn Ghee Roast - Mangalore style
 How to Cook Jackfruit Halwa
 How to cook Variety rice -Tamarind Coconut Curd Lemon Rice - புரட்டாசி சனிக்கிழமை Special
 How to cook Adai - Lentils pan cake
 Three Black crows in Bearish reversal candle stick pattern - Technical analysis #shorts #krinu
 How to Cook Soya Chunks Korma - Meal maker kurma
 How to cook Spongy fruit cake without Oven - New year 2020 Special
 What is Artificial Intelligence and Machine Learning Algorithms : Types of AI ML | Krinu
 How to cook Colocasia cauliflower Curry - ASMR Cooking
 What is a Cantilever - How to calculate the Effective Length of the Cantilever Beam
 How to cook Onion samosa - Tea time snack