Measuring zeta potential - effect of electrolyte
This is a recording of a webinar I gave on How To Measure Zeta Potential More Confidently.
I show you how you can maximize the confidence in your measurements - and their interpretation - needed for robust decision making.
Please sign up for my newsletter at http://tinyurl.com/zetanewsletter
Visit my website at https://enlightenscientific.com
Online training courses are being added to my school at https://learn.enlightenscientific.com
TRANSCRIPT
Let's look at the effect of different concentrations of the electrolyte on the thickness. On the top left, we have a dilute electrolyte. The decay is slow. At the highest salt concentration, shown on the bottom right, the double layer thickness is very thin compared to the most dilute salt concentration.
Here are all of these decays on a single chart including markers to represent the thicknesses of the double layers.
For an aqueous solution at room temperature, kappa is given by this equation
I is the ionic strength and is a measure of the concentration of all of the ionic species present taking into account their valencies since polyvalent ions are more effective at screening than monovalent ones.
So you can see that as you increase the ionic strength, the double layer becomes thinner and when it is very thin, it is said to be collapsed. So, this represents the repulsion between particles. How does that fit into the overall picture of colloidal interaction where you have attraction as well as repulsion?
According to the DLVO theory, you can add the inherent attractive potential energy (shown in blue) and the repulsive potential energy (in orange) to get the overall interaction energy (shown in grey).
Here, there is a barrier that prevents aggregation. Let's look at the four different salt concentrations.
The energy barrier becomes smaller as you increase the salt concentration. By time you get to the highest salt concentration, there is no barrier and the particles will aggregate. But it's not sufficient to refer to just the zeta potential to indicate the aggregation behavior of the system. I've assumed in these graphs that the zeta potential is the same. Yet, if you increase the salt concentration enough, you will induce aggregation. So the rule of thumb that people use that if zeta is greater than 25 millivolts then the dispersion will not aggregate can be very misleading and affect your interpretation of measured zeta potentials. You have to take into account the ionic strength, and you have to have some reasonable idea of the attraction. There's not much you can do about attraction in a dispersion. The two main factors which affect the attraction are the size of the particles and their optical properties. But you can control the electrostatic behavior through choice of electrolyte concentrations and addition of surfactants, for example.
Видео Measuring zeta potential - effect of electrolyte канала John Miller
Показать
Комментарии отсутствуют
Информация о видео
Другие видео канала
 Measuring zeta potential - electrophoresis
 Zeta Potential Tutorial | Part 1: Intro to Zeta Potential
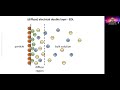 Measuring zeta potential - origin of zeta potential
 74 - DLVO Theory
 Electrical Double Layer
 Surface Zeta Potential
 Measuring zeta potential - calculating zeta potential
 Overview of Zeta Potential Concept, Measurement Use, and Applications
 The science of milk - Jonathan J. O'Sullivan
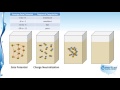 Zeta Potential
 Measuring zeta potential - electrophoretic light scattering
 Ep8 EDL forces, DLVO curves, electrolytes. UCSD, NANO 11/101, Darren Lipomi
 Zeta Potential Tutorial | Part 2: Performing a Measurement
 Tips for Woodworking Measurements and Layouts
 Theory of Thermodynamic Activity and Ionic Strength
 The Secret Knowledge Of Believing
 Measuring zeta potential - real world example
 Measuring zeta potential - introduction
 DLVO THEORY in English