Fishbone Cause and Effect Analysis and Example - Simplest Explanation Ever
Fishbone Cause and Effect Analysis explained with an Example - Simplest Explanation Ever
Fishbone Analysis or Fishbone Diagram is a a method of diving deep into a problem or concern and working out its causes. It is a way to ensure that problems are resolved and don't reoccur. We look at the concept in detail with an example.
Link to McKinsey's 7S Framework:
https://youtu.be/MKfuCdxpF4I
Please like our Facebook page and support us:
https://www.facebook.com/MisterSimplify/
Please like & share the video and subscribe to this channel to express support.
I intend to dedicate time and resources to add more content and address your concerns.
Music: http://www.bensound.com
Видео Fishbone Cause and Effect Analysis and Example - Simplest Explanation Ever канала Mister Simplify
Показать
Комментарии отсутствуют
Информация о видео
Другие видео канала
 Root Cause Analysis Techniques With Examples | Invensis Learning
 The Classic & Reverse Fishbone Diagram | A Whiteboard Training Video
 what is Cause & Effect Diagram (Fish Bone Diagram) in BPO? || Live Example 2020
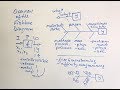 Six Sigma Overview | Fishbone Diagram | Green Belt 2.0® Lean Six Sigma | fkiQuality HD
 Business Process Re-engineering explained - Simplest Explanation Ever
 Attachment Theory and the Stages of Attachment - Simplest Explanation Ever
 Karen Horney's Psychoanalytic Social Theory and Neurosis - Simplest Explanation Ever
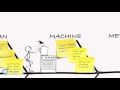 Fishbone (Cause & Effect or Ishikawa Diagram)
 Bandura's Social Learning Theory - Simplest Explanation Ever
 Hackman and Oldham's Job Characteristics - Simplest Explanation ever with Examples
 The Balanced Scorecard - Simplest explanation ever
 Cause and Effect Diagram Training Video (aka Fishbone Diagram & Ishikawa Diagram)
 Ratio Analysis: Return on Capital Employed (ROCE)
 VIRO Analysis Framework - Simplest Explanation Ever
 Eysenck's Theory of Personality - Simplest Explanation Ever
 The 5 Whys Explained - Root Cause Analysis
 Fishbone Diagram - Ishikawa Diagram - Cause and Effect Diagram
 PESTLE Analysis - The Simplest explanation ever
 TOWS Analysis Explained with an Example - Simplest Explanation Ever