- Популярные видео
- Авто
- Видео-блоги
- ДТП, аварии
- Для маленьких
- Еда, напитки
- Животные
- Закон и право
- Знаменитости
- Игры
- Искусство
- Комедии
- Красота, мода
- Кулинария, рецепты
- Люди
- Мото
- Музыка
- Мультфильмы
- Наука, технологии
- Новости
- Образование
- Политика
- Праздники
- Приколы
- Природа
- Происшествия
- Путешествия
- Развлечения
- Ржач
- Семья
- Сериалы
- Спорт
- Стиль жизни
- ТВ передачи
- Танцы
- Технологии
- Товары
- Ужасы
- Фильмы
- Шоу-бизнес
- Юмор
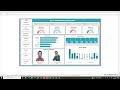
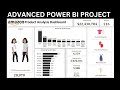
POWER BI PROJECT DASHBOARD - LEARN HOW TO USE PARAMETERS TO VISUALIZE VARIABLES IN POWER BI
Recently, I explored and utilized some Power BI feature which I use for report, and I will be sharing video tutorials on these features. One of the features is by creating a parameter in Power BI to allow users to dynamically select the comparison period for their analysis.
Parameters are a powerful tool in Power BI that allow for dynamic and customizable reports. If you need to analyze data for different categories or regions, you can make use of parameter feature in Power BI. This will allow you to easily switch between regions and compare results without having to create separate queries for each region or categories by implementing parameters, your data analysis become more efficient and flexible.
In this tutorial, I will walk you through how to create and use parameters to interact with different scenarios in your reports.
DOWNLOAD DATASET: https://docs.google.com/spreadsheets/d/1tdF_beuexr4n46cuZY8P-b8JCCYN-SNZ/edit?usp=drive_link
If you need help in creating dashboard and other data Analytics related issue, you can contact me directly on my LinkedIn:
https://www.linkedin.com/in/justinah-raphael-ojo-a46941127/
Join this channel to get access to perks:
https://www.youtube.com/channel/UC0OX1I42V2WwPl9FfL3-LKg/join
#dashboard #powerbi #powerbitraining #PowerBITutorial #powerbitraining #powerbitutorial #excel #dataanalytics #exceltips #powerbidax #dax #excel
#exceldashboard #exceldashboardstutorial #tableau #tableaututorial #tableaudesktop #powerpoint
Видео POWER BI PROJECT DASHBOARD - LEARN HOW TO USE PARAMETERS TO VISUALIZE VARIABLES IN POWER BI канала Justinah Raphael-Ojo
Комментарии отсутствуют
Информация о видео
6 сентября 2024 г. 15:10:39
00:45:17
Другие видео канала