
- Популярные видео
- Авто
- Видео-блоги
- ДТП, аварии
- Для маленьких
- Еда, напитки
- Животные
- Закон и право
- Знаменитости
- Игры
- Искусство
- Комедии
- Красота, мода
- Кулинария, рецепты
- Люди
- Мото
- Музыка
- Мультфильмы
- Наука, технологии
- Новости
- Образование
- Политика
- Праздники
- Приколы
- Природа
- Происшествия
- Путешествия
- Развлечения
- Ржач
- Семья
- Сериалы
- Спорт
- Стиль жизни
- ТВ передачи
- Танцы
- Технологии
- Товары
- Ужасы
- Фильмы
- Шоу-бизнес
- Юмор
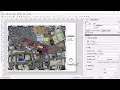
QGIS Crime Map Tutorial: Clean Excel Data, Join CSV to Shapefile & Visualize with Graduated Colors
Learn how to create a professional crime map in QGIS using real crime statistics from NMBS.
In this tutorial, I walk you through the complete workflow, from downloading the data, cleaning the Excel file, fixing formatting issues, joining the CSV to your shapefile, and finally creating a graduated color crime map.
🔗 DOWNLOAD the practice data & shapefile: https://t.me/gishausa/19
🔥 What you will learn in this video:
How to download and prepare crime data from NMBS
How to clean and arrange Excel data so it matches your shapefile
How to export shapefile attributes to CSV for data alignment
How to join CSV crime data back into QGIS
How to fix number fields that QGIS reads as string (text)
How to convert fields to Integer 64-bit using the Field Calculator
How to create a graduated color map to visualize crime levels
Tips for avoiding common join and data-type problems
🗂 Tools Used
QGIS (Any recent version)
Excel / CSV file
NMBS crime dataset
🎯 Perfect for:
Beginner GIS users
Students learning crime mapping
Urban planners
Researchers
Anyone who wants to visualize data on a map
If you find this tutorial helpful, don’t forget to Like, Share, and Subscribe for more QGIS and Urban Planning videos!
Видео QGIS Crime Map Tutorial: Clean Excel Data, Join CSV to Shapefile & Visualize with Graduated Colors канала Alinkura
In this tutorial, I walk you through the complete workflow, from downloading the data, cleaning the Excel file, fixing formatting issues, joining the CSV to your shapefile, and finally creating a graduated color crime map.
🔗 DOWNLOAD the practice data & shapefile: https://t.me/gishausa/19
🔥 What you will learn in this video:
How to download and prepare crime data from NMBS
How to clean and arrange Excel data so it matches your shapefile
How to export shapefile attributes to CSV for data alignment
How to join CSV crime data back into QGIS
How to fix number fields that QGIS reads as string (text)
How to convert fields to Integer 64-bit using the Field Calculator
How to create a graduated color map to visualize crime levels
Tips for avoiding common join and data-type problems
🗂 Tools Used
QGIS (Any recent version)
Excel / CSV file
NMBS crime dataset
🎯 Perfect for:
Beginner GIS users
Students learning crime mapping
Urban planners
Researchers
Anyone who wants to visualize data on a map
If you find this tutorial helpful, don’t forget to Like, Share, and Subscribe for more QGIS and Urban Planning videos!
Видео QGIS Crime Map Tutorial: Clean Excel Data, Join CSV to Shapefile & Visualize with Graduated Colors канала Alinkura
Комментарии отсутствуют
Информация о видео
3 декабря 2025 г. 5:22:25
00:23:58
Другие видео канала
 Download High-Resolution Satellite Imagery in QGIS | HAUSA |
 Digitizing Maps in QGIS | HAUSA | Step-by-Step
 How to Calculate Area and Length in QGIS | Hausa Tutorial
 QGIS Symbology for Beginners | How to Style & Color Points, Lines, Polygons Categorize by District
 How to Georeference an Image in QGIS Using a CSV File
 How to Install QGIS Complete Beginner Guide (HAUSA)
 How to Create a Contour Map in QGIS (HAUSA)
 Study Area Map in QGIS HAUSA: Step-by-Step Beginner’s Guide
 Exporting work from QGIS
