
- Популярные видео
- Авто
- Видео-блоги
- ДТП, аварии
- Для маленьких
- Еда, напитки
- Животные
- Закон и право
- Знаменитости
- Игры
- Искусство
- Комедии
- Красота, мода
- Кулинария, рецепты
- Люди
- Мото
- Музыка
- Мультфильмы
- Наука, технологии
- Новости
- Образование
- Политика
- Праздники
- Приколы
- Природа
- Происшествия
- Путешествия
- Развлечения
- Ржач
- Семья
- Сериалы
- Спорт
- Стиль жизни
- ТВ передачи
- Танцы
- Технологии
- Товары
- Ужасы
- Фильмы
- Шоу-бизнес
- Юмор
Agglomerative Clustering with Python: Dendrogram, Heat Map
Agglomerative Clustering: Start with each item as an individual unit, and then create clusters by combining clusters together.
Types:
* Single linkage: use minimum distance.
* Complete linkage: use maximum distance.
* Average linkage: use average distance.
* Centroid linkage: distance between group means.
* Ward's Method: considers loss of information between individual records and group mean.
A dendrogram is a nice way to cluster, and view clusters. A dendrogram gives a visual indication of clusters merging.
In this video, I create a dendrogram of Ohio counties.
I import the Ohio county data, and then compute distances. After that, I noke the dendrogram function to generate a dendrogram.
To validate clusters, we consider:
- Cluster interpretability. Is the interpretation reasonable?
* Obtain summary statistics from each cluster
* Examine clusters for separation among common feature that was not used in analysis.
* Label the clusters
- Stability: do clusters change if some of the inputs are altered?
* Partition the data to see how well clusters form based on the two parts.
- Cluster separation: the ratio of variation between cluster to variation within the cluster
- Number of clusters
Next, I create a heatmap to give a visualization to the factors that were considered in the cluster. We can create a heatmap with sns.clustermap() function. This also gives us a dendrogram.
A few limitations:
- It's computationally expensive for large datasets.
- Algortihm makes one pass at the data, so a mistake early cannot be reallocated.
- Low stability: dropping records can lead to a different solution.
- Sensitive to outliers.
Видео Agglomerative Clustering with Python: Dendrogram, Heat Map канала Brandan Jones
Types:
* Single linkage: use minimum distance.
* Complete linkage: use maximum distance.
* Average linkage: use average distance.
* Centroid linkage: distance between group means.
* Ward's Method: considers loss of information between individual records and group mean.
A dendrogram is a nice way to cluster, and view clusters. A dendrogram gives a visual indication of clusters merging.
In this video, I create a dendrogram of Ohio counties.
I import the Ohio county data, and then compute distances. After that, I noke the dendrogram function to generate a dendrogram.
To validate clusters, we consider:
- Cluster interpretability. Is the interpretation reasonable?
* Obtain summary statistics from each cluster
* Examine clusters for separation among common feature that was not used in analysis.
* Label the clusters
- Stability: do clusters change if some of the inputs are altered?
* Partition the data to see how well clusters form based on the two parts.
- Cluster separation: the ratio of variation between cluster to variation within the cluster
- Number of clusters
Next, I create a heatmap to give a visualization to the factors that were considered in the cluster. We can create a heatmap with sns.clustermap() function. This also gives us a dendrogram.
A few limitations:
- It's computationally expensive for large datasets.
- Algortihm makes one pass at the data, so a mistake early cannot be reallocated.
- Low stability: dropping records can lead to a different solution.
- Sensitive to outliers.
Видео Agglomerative Clustering with Python: Dendrogram, Heat Map канала Brandan Jones
Комментарии отсутствуют
Информация о видео
25 августа 2025 г. 3:00:01
00:09:47
Другие видео канала
 Simple Explanation of Dictionary in Python
 Overview of Abstract Class Method and Template Design
 Mobile Programming Part 13: Beginning Networking
 Concept for learning chemistry Android game
 Cicadas attack Cincinnati!
 Create and Deploy Simple Project to Azure
 REST Microservice Essentials: HTTP Actions and Status Codes
 Customizing Colors and Themes in Jetpack Compose application
 Setup Firebase Database and include in our Jetpack Compose project
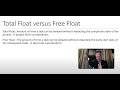 Free Float vs Total Float in Project Management
 What is Critical Path Computing Early Start, Late Start, Early Finish, and Late Finish
 Create a DataFrame from multiple Series and Arrays in Python
 Exception Best Practices Demonstrated in IntelliJ IDEA
 Playlist Overview: Android Q, MVVM, LiveData, Firebase
 Use @Exclude to Prevent a Field from Storing to Firebase Firestore in Android with Kotlin data class
 Interfaces and Polymorphism
 Moving Face Sculpture in Prague Cz
 Logistic Regression Overview with the Iris Dataset
 Python DataFrame: finding max, mean, statistical functions, and complex selections
 Using Stack Data Structure in Java, Applied
