Bollinger Bands: Beginner Guide
Bollinger Bands are one of the most popular trading indicators and in this video we'll give you a tutorial on what they are and how you can use them in your trading.
The bands themselves represent two volatility lines around the (typically) 20-day moving average. The two bands are placed at 2 standard deviations from the moving average. This is the concept that John Bollinger came up with in the 1980s.
This statistical approach to trading takes the concept of standard deviations and places it on the chart. The idea behind it is that because standard deviations cover 95% of occurrences, this could mean that 95 out of 100 times, the price will stay within those bands.
Additionally, the moves towards each band can be taken as buy or sell signals. For example if the price starts approaching the upper band, then we might take that as a sign that the market is overbought and the price could probably fall. Vice versa, when the price drops to the lower band, then that would mean that the market is oversold.
Watch the video for even more details about this indicator and let us know in the comments if you have any questions.
At Trading 212 we provide an execution only service. This video should not be construed as investment advice. Investments can fall and rise. Capital at risk. CFDs are higher risk because of leverage.
Видео Bollinger Bands: Beginner Guide канала Trading 212
Показать
Комментарии отсутствуют
Информация о видео
Другие видео канала
 What are Fibonacci Retracements
 Bollinger Bands and RSI Trading Strategy (Simple and Effective)
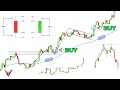 The Only Technical Analysis Video You Will Ever Need... (Full Course: Beginner To Advanced)
 How to Read Candlestick Charts
 BEST Bollinger Bands Breakout Strategy For Daytrading Forex (Bollinger Bands Tutorial)
 How to Use Bollinger Bands®
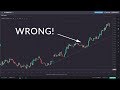 3 Most Common Trading Mistakes
 The Ultimate Candlestick Patterns Trading Course (For Beginners)
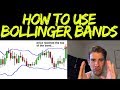 How to Use Bollinger Bands to Pinpoint Support and Resistance Levels
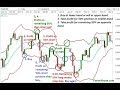 Master Bollinger Bands in Just One Class
 الكشف عن طريقتي السهلة والمربحة لاستخدام مؤشر البولنجر باند كمحترف (Bollinger Bands)
 The Stochastic Oscillator Explained
 TOP 5 Bollinger Bands SECRETS (MUST SEE!)
 The Only Moving Average Trading Video You Will Ever Need...
 Beginner Guide to the RSI Indicator
 5 Things To Look For Before You Place A Trade (Price Action Trading Strategy)
 John Bollinger on Bollinger Bands for MetaStock
 Bollinger Bands Strategies THAT ACTUALLY WORK (Trading Systems With BB Indicator)
 How to Recognize False Breakouts
 Bollinger Bands Trading Strategy: How to Trade it Like a PRO