- Популярные видео
- Авто
- Видео-блоги
- ДТП, аварии
- Для маленьких
- Еда, напитки
- Животные
- Закон и право
- Знаменитости
- Игры
- Искусство
- Комедии
- Красота, мода
- Кулинария, рецепты
- Люди
- Мото
- Музыка
- Мультфильмы
- Наука, технологии
- Новости
- Образование
- Политика
- Праздники
- Приколы
- Природа
- Происшествия
- Путешествия
- Развлечения
- Ржач
- Семья
- Сериалы
- Спорт
- Стиль жизни
- ТВ передачи
- Танцы
- Технологии
- Товары
- Ужасы
- Фильмы
- Шоу-бизнес
- Юмор
Creating a Cool Dashboard with React, Styled-Components, Redux, and Recharts | Step-by-Step Tutorial
Creating a Cool Dashboard with React, Styled-Components, Redux, and Recharts | Step-by-Step Tutorial
--------------------------
👨💻 Finished File: https://github.com/prabinmagar/horizon-dashboard-design-with-styled-components---recharts.git
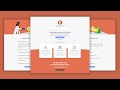
Welcome to our comprehensive tutorial on Creating a Stunning Dashboard with React, Styled-Components, Redux, and Recharts! In this step-by-step guide, we'll walk you through the process of building a modern and interactive dashboard from scratch. This video is perfect for developers looking to enhance their skills in React and its ecosystem.
What You'll Learn:
1. Setting Up the Project: We'll start by setting up a new React project and installing all necessary dependencies.
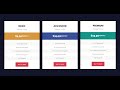
2. Styled-Components for Styling: Learn how to use styled-components to create reusable and maintainable CSS for your dashboard.
3. Redux for State Management: Implement Redux to manage the state of your application efficiently.
4. Creating Custom Charts with Recharts: Discover how to integrate Recharts to create beautiful and responsive charts, including line charts, bar charts, pie charts, and more.
5. Building Interactive Components: Design interactive and user-friendly components for data visualization and user interaction.
6. Connecting to APIs: Fetch and display data from APIs to make your dashboard dynamic and real-time.
Best Practices: Tips and best practices for organizing your code, improving performance, and ensuring scalability.
Keywords:
#ReactJS
#StyledComponents
#Redux
#Recharts
#DashboardDesign
#WebDevelopment
#FrontendDevelopment
#DataVisualization
#JavaScript
#ReactTutorial
Resources:
GitHub Repository - Access the complete source code for this project.
Styled-Components Documentation
Redux Documentation
Recharts Documentation
📌Follow me on:
Github: https://github.com/prabinmagar
Facebook Page: https://www.facebook.com/profile.php?id=61555836314567
Instagram: https://www.instagram.com/geekprobin/
Like, Share, and Subscribe! Help us grow our community on YouTube.
If you enjoyed this video and found it helpful, please give it a thumbs up and hit that "Like" button. It really means a lot to us and helps our channel reach more people.
Thank you for your support, and we look forward to bringing you more valuable content in the future. Stay tuned, and let's make GeekProbin a thriving hub for frontend web enthusiasts like yourself!
Видео Creating a Cool Dashboard with React, Styled-Components, Redux, and Recharts | Step-by-Step Tutorial канала GeekProbin
--------------------------
👨💻 Finished File: https://github.com/prabinmagar/horizon-dashboard-design-with-styled-components---recharts.git
Welcome to our comprehensive tutorial on Creating a Stunning Dashboard with React, Styled-Components, Redux, and Recharts! In this step-by-step guide, we'll walk you through the process of building a modern and interactive dashboard from scratch. This video is perfect for developers looking to enhance their skills in React and its ecosystem.
What You'll Learn:
1. Setting Up the Project: We'll start by setting up a new React project and installing all necessary dependencies.
2. Styled-Components for Styling: Learn how to use styled-components to create reusable and maintainable CSS for your dashboard.
3. Redux for State Management: Implement Redux to manage the state of your application efficiently.
4. Creating Custom Charts with Recharts: Discover how to integrate Recharts to create beautiful and responsive charts, including line charts, bar charts, pie charts, and more.
5. Building Interactive Components: Design interactive and user-friendly components for data visualization and user interaction.
6. Connecting to APIs: Fetch and display data from APIs to make your dashboard dynamic and real-time.
Best Practices: Tips and best practices for organizing your code, improving performance, and ensuring scalability.
Keywords:
#ReactJS
#StyledComponents
#Redux
#Recharts
#DashboardDesign
#WebDevelopment
#FrontendDevelopment
#DataVisualization
#JavaScript
#ReactTutorial
Resources:
GitHub Repository - Access the complete source code for this project.
Styled-Components Documentation
Redux Documentation
Recharts Documentation
📌Follow me on:
Github: https://github.com/prabinmagar
Facebook Page: https://www.facebook.com/profile.php?id=61555836314567
Instagram: https://www.instagram.com/geekprobin/
Like, Share, and Subscribe! Help us grow our community on YouTube.
If you enjoyed this video and found it helpful, please give it a thumbs up and hit that "Like" button. It really means a lot to us and helps our channel reach more people.
Thank you for your support, and we look forward to bringing you more valuable content in the future. Stay tuned, and let's make GeekProbin a thriving hub for frontend web enthusiasts like yourself!
Видео Creating a Cool Dashboard with React, Styled-Components, Redux, and Recharts | Step-by-Step Tutorial канала GeekProbin
react admin dashboard react admin dashboard build a dashboard in react js react dashboard dashboard admin dashboard design admin dashboard html react website react project recharts react admin panel react dashboard tutorial react admin react chart react charts admin dashboard react react dashboard template react tutorial admin dashboard in react js react admin dashboard tutorial react admin dashboard design tutorial with api
Комментарии отсутствуют
Информация о видео
8 июля 2024 г. 6:07:14
03:23:17
Другие видео канала