RSI Divergence Trading Strategy Explained (Highly Effective)
In today's Trading Beacon tutorial, we'll explain an RSI Divergence Trading Strategy. The RSI indicator is commonly used to help find divergence, as it can often be effective in different kinds of trading strategies.
So if you're looking for an effective rsi divergence trading strategy, make sure to tune in for this video!
-------------------------------
✅ Subscribe Now: https://www.youtube.com/channel/UCDSBQnqFvO6h3CDCSWkyZCg?sub_confirmation=1
📈 Free Trading Tutorials: https://www.youtube.com/playlist?list=PLoy2CgfUTK0IzfQgJLmT0TKihSwnND62B
-------------------------------
POPULAR UPLOADS:
👉 The #1 Indicator For Trading:
https://www.youtube.com/watch?v=XWt8h1aw-M0
👉 How To Grow a Small Trading Account:
https://www.youtube.com/watch?v=bsByeHmjNnY
👉 Bollinger Bands and RSI Strategy:
https://www.youtube.com/watch?v=GiHv0govSck
👉 Beginners Trading Strategy:
https://www.youtube.com/watch?v=0DtcesS3HzE
👉 MACD Trading Strategy (Explained):
https://www.youtube.com/watch?v=kTo9_aufCtY
👉 Heikin Ashi Trading Strategy:
https://www.youtube.com/watch?v=vREx1YlVyKE
-------------------------------
Here we have a chart where price is moving down as selling pressure is coming into the market. This downwards move on the price chart is mirrored fairly closely on the RSI, as the RSI line moves down too. We see a small pullback in price which stops short at a level of resistance. Again, we see this movement mirrored on the RSI. Next we see another push down from price, which moves below the previous low. So price has made a low here, followed by a lower low. But if we match these price swings up with what happened on the RSI during that same period of time, we can see that there is a difference. Price made a low followed by a lower low, but the RSI made a low followed by a higher low. This is an example of a bullish divergence, and it can often result in some great buy trade opportunities. However, there are a few rules we need to follow to ensure we’re taking only high-probability divergence trades.
Here we have a move up from price, a retracement, and another move up. You can see similar movement mirrored on the RSI: With a move up, a retracement, and then another move up. Now again, let’s match up the price swings with the RSI: So price made a high, followed by a higher high. But looking at the RSI during this same period of time, we see a high followed by a lower high. This is an example of bearish divergence.
So the #1 mistake I see people making when taking divergence trades, is that they don’t wait for the RSI line to hit an extreme first. If I zoom in on the RSI you’ll see these dotted lines at the top and bottom of the indicator. The top dotted line is called the “upper band”, and it represents when the RSI is moving into an overbought area. And the bottom dotted line is called the “lower band”, and it represents when the RSI is moving into an oversold area. I’ll put the current settings for the upper and lower bands on the screen now, but you may wish to use slightly different settings depending on the market you’re trading
-------------------------------
Beauty Flow by Kevin MacLeod
Link: https://incompetech.filmmusic.io/song/5025-beauty-flow
License: http://creativecommons.org/licenses/by/4.0/
-------------------------------
DISCLAIMER:
Foreign exchange trading on margin carries a high level of risk and may not be suitable for all investors. The high degree of leverage can work against you as well as for you. Before deciding to invest in foreign exchange you should carefully consider your investment objectives, level of experience and risk appetite. The possibility exists that you could sustain a loss of some or all of your initial investment and, therefore, you should not invest money that you cannot afford to lose. You should be aware of all the risks associated with foreign exchange trading and seek advice from an independent financial advisor if you have any doubts. Past performance is not indicative of future results. The information presented today is not meant for use in live trading.
This video is not a recommendation to anyone on how to spend or invest their money. Take all videos as my own opinion, as entertainment, and at your own risk. I do not assume any responsibility or liability for any errors or omission in the content of this channel. This content is for educational purposes only, and is not tax, legal, financial or professional advice. Any action you take on the information in this video is strictly at your own risk. TradingBeacon.com and all individuals affiliated with this channel assume no responsibilities for your trading and investment results.
-------------------------------
#Trading
Видео RSI Divergence Trading Strategy Explained (Highly Effective) канала Trading Beacon
Показать
Комментарии отсутствуют
Информация о видео
Другие видео канала
 RSI Divergence Trading Strategy
 Institutional Trading: How to Trade With the MARKET MAKERS (Forex Trading Strategy)
 Bollinger Bands and RSI Trading Strategy (Simple and Effective)
 99.99% Of Traders Make This Mistake (Price Action)
 Hidden Divergence. How to spot it and what it means.
 The #1 Indicator On TradingView: Squeeze Momentum Indicator Strategy (Lazybear)
 3 Ways to INSTANTLY Improve Your Trading
 Best RSI Indicator Trading Strategy - Wysetrade Method
 Know where a pullback will end every time
 MACD Indicator Explained: Best Trading Strategy (Highly Effective)
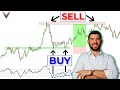 Master The Double Bottom + RSI Divergence Trading Strategy (Full Course)
 🔴 CCI Indicator Strategy for Winning Trades | Better than RSI..?
 I Traded Bitcoin For 8 Hours Straight On The 1 Minute Chart - CRAZY RESULTS
 How To Find HIGH ACCURACY Key Levels (Forex Trading Tutorial)
 The Ultimate Trading Guide to Hidden Divergences (From Novice to Pro)
 Best 2 Period RSI Pullback Trading Strategy (In Depth Tutorial)
 How To Use The Accumulation Distribution Indicator (Trading Strategy)
 BEST Stochastic Indicator Trading Strategy (Explained)
 Forex Swing Trading Strategies That Work (Daily Chart)