- Популярные видео
- Авто
- Видео-блоги
- ДТП, аварии
- Для маленьких
- Еда, напитки
- Животные
- Закон и право
- Знаменитости
- Игры
- Искусство
- Комедии
- Красота, мода
- Кулинария, рецепты
- Люди
- Мото
- Музыка
- Мультфильмы
- Наука, технологии
- Новости
- Образование
- Политика
- Праздники
- Приколы
- Природа
- Происшествия
- Путешествия
- Развлечения
- Ржач
- Семья
- Сериалы
- Спорт
- Стиль жизни
- ТВ передачи
- Танцы
- Технологии
- Товары
- Ужасы
- Фильмы
- Шоу-бизнес
- Юмор
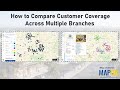
How to Map Public Park Accessibility & Embed It on Any Website #mapog #technology #gismapping #share
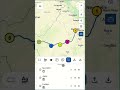
📌 Static images and PDF reports fail to capture how accessible public parks truly are. How can planners, NGOs, bloggers, and educators visualize walkability and green space equity in a way that's interactive and engaging?
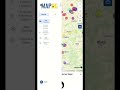
✅ Use MAPOG—a free, no-code GIS tool—to create and embed live accessibility maps directly into your blog, website, or report. No technical skills required!
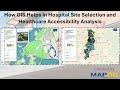
🎯 In this step-by-step video, you’ll learn how to:
✅ Create a public park accessibility map from scratch
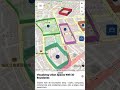
✅ Use GIS tools like Buffer (1 KM radius) and Isochrone (10-minute walk zones)
✅ Add administrative boundaries and park layers
✅ Visualize catchment zones and underserved areas
✅ Share or embed your interactive map just like a YouTube video!
🚀 Perfect for:
Urban Planners
Policy Researchers
Local Government Reports
Environmental NGOs
Accessibility Advocates
Blog Writers and Content Creators
🌐 Explore MAPOG:
👉 https://story.mapog.com/?utm_source=Youtube&utm_medium=YoutubeVideo&utm_campaign=MapStory
📩 : support@mapog.com
#publicparks #accessibility #gismapping #mapog #greenspaces #urbanplanning #livemap #nocode #story #urbandesign #walkability #mapping #spatialstructures #safari
Видео How to Map Public Park Accessibility & Embed It on Any Website #mapog #technology #gismapping #share канала MAPOG
✅ Use MAPOG—a free, no-code GIS tool—to create and embed live accessibility maps directly into your blog, website, or report. No technical skills required!
🎯 In this step-by-step video, you’ll learn how to:
✅ Create a public park accessibility map from scratch
✅ Use GIS tools like Buffer (1 KM radius) and Isochrone (10-minute walk zones)
✅ Add administrative boundaries and park layers
✅ Visualize catchment zones and underserved areas
✅ Share or embed your interactive map just like a YouTube video!
🚀 Perfect for:
Urban Planners
Policy Researchers
Local Government Reports
Environmental NGOs
Accessibility Advocates
Blog Writers and Content Creators
🌐 Explore MAPOG:
👉 https://story.mapog.com/?utm_source=Youtube&utm_medium=YoutubeVideo&utm_campaign=MapStory
📩 : support@mapog.com
#publicparks #accessibility #gismapping #mapog #greenspaces #urbanplanning #livemap #nocode #story #urbandesign #walkability #mapping #spatialstructures #safari
Видео How to Map Public Park Accessibility & Embed It on Any Website #mapog #technology #gismapping #share канала MAPOG
Комментарии отсутствуют
Информация о видео
27 июня 2025 г. 10:59:24
00:02:13
Другие видео канала