Traders! Here's the ULTIMATE Beginners Guide to Reading a Candlestick Chart
If you're trading short term, you need to use candlestick charts. But you can’t use them if you don’t understand them. Today, Tim Bohen will teach you about candlestick charts — what they can show you and how to read them.
🔴 Subscribe for more free Stock Trading tips: YouTube.com/StocksToTrade
Share this video with a fellow Trader: https://youtu.be/nvw8p6jaBO4
✅ Links we mention and recommend:
Try StocksToTrade for $7: https://stockstotrade.com/14daytrial/
Get our FREE weekly watchlist here: https://stockstotrade.com/watchlist
Check out the SteadyTrade podcast: https://steadytrade.com
✅ Recommended video: https://youtu.be/6MkRxIXhj_c
✅ Recommended playlists:
Stock Trading 101: A Day Trader's Guide: https://www.youtube.com/watch?v=G_v3GMkKCjk&list=PLWWz2BSabm3bG64ohfJ-CnnVTjLCWwvei
Advanced Stock Trading Tips: https://www.youtube.com/watch?v=OXLs_-PgMUk&list=PLWWz2BSabm3YCZdk7ocrBXGJaLVXXFUYb
StocksToTrade Software Tips and Tricks: https://www.youtube.com/watch?v=jiTi-chHNyo&list=PLWWz2BSabm3ay_lvQC9JN_1niB78bI7ga
Weekly Trading Recap Videos: https://www.youtube.com/watch?v=_n0XaDt1XFY&list=PLWWz2BSabm3b3-4DcEx98TzNPLAKcq6ES
✅ Follow StocksToTrade on social media:
Instagram: https://www.instagram.com/stockstotrade/
Facebook: https://www.facebook.com/StocksToTrade/
Twitter: https://twitter.com/StocksToTrade
Don’t think candlestick charts are super complex. Sure, there are some things to learn, but once you understand them and practice using them, they can be useful in your trading.
First, each candle marks one trading day. And if the candle has a really small body, that tells you that the stock opened and closed at almost the exact same price. That's what we call a doji candle. And that also tells you that for that trading day, the stock basically did nothing.
When a red candle opens a few dollars higher than its previous close, that’s called a gap-up. That’s something to focus on for potential trades.
Now, say a stock opens at $9 and then closes at $8.25. The candle is red because the stock’s closing price is lower than its opening price. That's the beauty of candlestick charts ... With a glance you can see a stock’s daily price action and range.
So that’s a bit on the candle bodies, but there are also the candle wicks. Those are the small lines on the candle that can show you the stock’s high and low of that trading day. With a quick look, you can see if the stock gapped-up, ran, pulled back, dropped hard, or bounced.
Here’s another thing you can learn from candlestick charts: volume. On the volume candlesticks, you won’t see wicks. These are strictly a chart annotation, a bar chart in essence. They just show you the total volume. And that’s an important indicator for short-term traders.
It’s amazing the amount of information you get just from looking at a candlestick chart. You can see if the stock closed higher than it opened, the bottom and upper ranges, the volume, and more. Get to know these charts — they can be so useful in trading.
And if you’re still intimidated, watch this video until it’s more clear. Then check out the candlesticks on your favorite stocks and practice, practice, practice!
#StocksToTrade #CandlestickCharts #BeginnersGuide
----------------------------------------------------------------------------------------------------------------
*Tim Bohen teaches skills others have used to make money. Most who receive free or paid content will make little or no money because they will not apply the skills being taught. Any results displayed may be exceptional. We do not guarantee any outcome regarding your earnings or income as the factors that impact such results are numerous and uncontrollable.
You can lose money trading stocks. Do not invest money you cannot afford to lose. You understand and agree you will consider the important risk factors in deciding to purchase any of our products or services.
Видео Traders! Here's the ULTIMATE Beginners Guide to Reading a Candlestick Chart канала StocksToTrade
Показать
Комментарии отсутствуют
Информация о видео
Другие видео канала
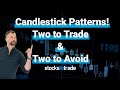 Candlestick Patterns: Two to Trade & Two to Avoid
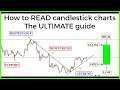 Candlestick charts: The ULTIMATE beginners guide to reading a candlestick chart
 How To Get Around The PDT Rule With A Small Account
 Lessons From One Of My Top Upcoming Female Students
 Stupid Simple (& Effective) Day-Trading Patterns for Beginners
 The Ultimate Candlestick Patterns Trading Course (For Beginners)
 The COMPLETE GUIDE to Online Brokers In CANADA (2021) | Questrade Review, Wealthsimple Trade & MORE
 Patterns to Focus On (& Avoid) In the Stock Market
 The Dip and Rip Is a Top Trading Pattern for 2020: Learn This Now!
 How to Use the 5-Minute Candle Theory in Your Trading Plan
 How to Use Level 2 While Trading Stocks
 The Short Squeeze: How to Ride the Momentum
 Top 5 Stock Trading Books You Must Read
 How To Find Support And Resistance Levels (Easily)
 Scalping: An effective and highly profitable trading strategy
 Power Hour Stocks: What Is It and How Do I Take Advantage of It?
 Candlestick Pattern Course For Beginners (patterns that actually work)
 Day Trading Indicator Set Up for Beginners 2022 (How to use VWAP, RSI, MACD Indicators)
 How to Read Stocks for Dummies Tutorial - Investing 101