Candlestick Patterns: Two to Trade & Two to Avoid
Candlestick chart patterns are SO important. They can repeat over and over. You need to learn to recognize them so you can spot solid trade opportunities. Today, Tim Bohen will discuss two patterns you should look for — and two you should avoid.
🔴 Subscribe for more free Stock Trading tips: YouTube.com/StocksToTrade
Share this video with a fellow Trader: https://youtu.be/Jwqbhh3lBYI
✅ Links we mention and recommend:
Try StocksToTrade for $7: https://stockstotrade.com/14daytrial/
Get our FREE weekly watchlist here: https://stockstotrade.com/watchlist
Check out the SteadyTrade podcast: https://steadytrade.com
✅ Recommended video: https://youtu.be/nvw8p6jaBO4
✅ Recommended playlists:
Stock Trading 101: A Day Trader's Guide: https://www.youtube.com/watch?v=G_v3GMkKCjk&list=PLWWz2BSabm3bG64ohfJ-CnnVTjLCWwvei
Advanced Stock Trading Tips: https://www.youtube.com/watch?v=OXLs_-PgMUk&list=PLWWz2BSabm3YCZdk7ocrBXGJaLVXXFUYb
StocksToTrade Software Tips and Tricks: https://www.youtube.com/watch?v=jiTi-chHNyo&list=PLWWz2BSabm3ay_lvQC9JN_1niB78bI7ga
Weekly Trading Recap Videos: https://www.youtube.com/watch?v=_n0XaDt1XFY&list=PLWWz2BSabm3b3-4DcEx98TzNPLAKcq6ES
✅ Follow StocksToTrade on social media:
Instagram: https://www.instagram.com/stockstotrade/
Facebook: https://www.facebook.com/StocksToTrade/
Twitter: https://twitter.com/StocksToTrade
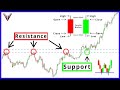
Let’s start with patterns you should trade ... like the bullish uptrending chart. It has a long history of consolidation, a big high-volume breakout, and then it just gradually uptrends. Look for those higher lows and higher highs — these are where you want to draw your trend lines.
That's the kind of chart you want to look for. Gradually uptrending, breaking out on the 52-week chart, with building volume, higher lows, and higher highs.
Next, let’s look at a consolidation and breakout chart. Gap up, consolidate, and then re-breakout. You can actually set alerts in StocksToTrade or whatever platform you're using for this pattern. So if you miss these big gap ups, you can set an alert at that next breakout area.
For example, say you have a big high-volume candle. It gaps up, and the stock goes into consolidation mode. Consolidation mode means it's in a tight band. The stock is just tracking sideways ... It's not breaking out, but it's also not breaking down. That means the stock is collecting buyers. It's building momentum, and it's holding its gains.
Now everyone is looking for that next breakout area. You're looking to buy those breakouts with risk. You set your risk on the failed breakout level. Not every trade will work, but these are common patterns.
Now, onto the two patterns you should avoid...
Let’s say a stock does nothing for a year but drop lower and lower. Every single day it just trends lower. And when it does bounce, it closes on the low of the day, then continues its trend down lower. That’s what we call a ‘dead cat bounce.’ Don’t EVER try to trade this pattern.
This is a stock, until something significant happens, that you should avoid. The risk/reward just isn’t there on the long-term downtrending chart.
The last one I want you to avoid is what we call the ‘one and done.’ This is a chart where the stock spikes, but then those doji candles pop up. Every time the stock spikes, it spikes up but then closes almost on the low of the day. It’s possible to win here and there. But these stocks tend to squeeze, drop, and stop you out. And that can create frustrating losses.
So remember, the bullish uptrending chart and the consolidation breakout are two you should focus on. And you should avoid the long-term downtrend (the dead cat bounce) as well as the one and done.
#StocksToTrade #StockMarket #CandlestickPatterns
----------------------------------------------------------------------------------------------------------------
*Tim Bohen teaches skills others have used to make money. Most who receive free or paid content will make little or no money because they will not apply the skills being taught. Any results displayed may be exceptional. We do not guarantee any outcome regarding your earnings or income as the factors that impact such results are numerous and uncontrollable.
You can lose money trading stocks. Do not invest money you cannot afford to lose. You understand and agree you will consider the important risk factors in deciding to purchase any of our products or services.
Видео Candlestick Patterns: Two to Trade & Two to Avoid канала StocksToTrade
🔴 Subscribe for more free Stock Trading tips: YouTube.com/StocksToTrade
Share this video with a fellow Trader: https://youtu.be/Jwqbhh3lBYI
✅ Links we mention and recommend:
Try StocksToTrade for $7: https://stockstotrade.com/14daytrial/
Get our FREE weekly watchlist here: https://stockstotrade.com/watchlist
Check out the SteadyTrade podcast: https://steadytrade.com
✅ Recommended video: https://youtu.be/nvw8p6jaBO4
✅ Recommended playlists:
Stock Trading 101: A Day Trader's Guide: https://www.youtube.com/watch?v=G_v3GMkKCjk&list=PLWWz2BSabm3bG64ohfJ-CnnVTjLCWwvei
Advanced Stock Trading Tips: https://www.youtube.com/watch?v=OXLs_-PgMUk&list=PLWWz2BSabm3YCZdk7ocrBXGJaLVXXFUYb
StocksToTrade Software Tips and Tricks: https://www.youtube.com/watch?v=jiTi-chHNyo&list=PLWWz2BSabm3ay_lvQC9JN_1niB78bI7ga
Weekly Trading Recap Videos: https://www.youtube.com/watch?v=_n0XaDt1XFY&list=PLWWz2BSabm3b3-4DcEx98TzNPLAKcq6ES
✅ Follow StocksToTrade on social media:
Instagram: https://www.instagram.com/stockstotrade/
Facebook: https://www.facebook.com/StocksToTrade/
Twitter: https://twitter.com/StocksToTrade
Let’s start with patterns you should trade ... like the bullish uptrending chart. It has a long history of consolidation, a big high-volume breakout, and then it just gradually uptrends. Look for those higher lows and higher highs — these are where you want to draw your trend lines.
That's the kind of chart you want to look for. Gradually uptrending, breaking out on the 52-week chart, with building volume, higher lows, and higher highs.
Next, let’s look at a consolidation and breakout chart. Gap up, consolidate, and then re-breakout. You can actually set alerts in StocksToTrade or whatever platform you're using for this pattern. So if you miss these big gap ups, you can set an alert at that next breakout area.
For example, say you have a big high-volume candle. It gaps up, and the stock goes into consolidation mode. Consolidation mode means it's in a tight band. The stock is just tracking sideways ... It's not breaking out, but it's also not breaking down. That means the stock is collecting buyers. It's building momentum, and it's holding its gains.
Now everyone is looking for that next breakout area. You're looking to buy those breakouts with risk. You set your risk on the failed breakout level. Not every trade will work, but these are common patterns.
Now, onto the two patterns you should avoid...
Let’s say a stock does nothing for a year but drop lower and lower. Every single day it just trends lower. And when it does bounce, it closes on the low of the day, then continues its trend down lower. That’s what we call a ‘dead cat bounce.’ Don’t EVER try to trade this pattern.
This is a stock, until something significant happens, that you should avoid. The risk/reward just isn’t there on the long-term downtrending chart.
The last one I want you to avoid is what we call the ‘one and done.’ This is a chart where the stock spikes, but then those doji candles pop up. Every time the stock spikes, it spikes up but then closes almost on the low of the day. It’s possible to win here and there. But these stocks tend to squeeze, drop, and stop you out. And that can create frustrating losses.
So remember, the bullish uptrending chart and the consolidation breakout are two you should focus on. And you should avoid the long-term downtrend (the dead cat bounce) as well as the one and done.
#StocksToTrade #StockMarket #CandlestickPatterns
----------------------------------------------------------------------------------------------------------------
*Tim Bohen teaches skills others have used to make money. Most who receive free or paid content will make little or no money because they will not apply the skills being taught. Any results displayed may be exceptional. We do not guarantee any outcome regarding your earnings or income as the factors that impact such results are numerous and uncontrollable.
You can lose money trading stocks. Do not invest money you cannot afford to lose. You understand and agree you will consider the important risk factors in deciding to purchase any of our products or services.
Видео Candlestick Patterns: Two to Trade & Two to Avoid канала StocksToTrade
Показать
Комментарии отсутствуют
Информация о видео
Другие видео канала
 Candlestick Pattern Course For Beginners (patterns that actually work)
 Understanding Chart Patterns for Online Trading
 New Traders: Here's How to Find Morning Panic Dip Buys
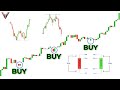 The Only Candlestick Patterns Trading Video You Will Ever Need... (Beginner To Advanced)
 5 Ways to Avoid False Breakouts
 Stupid Simple (& Effective) Day-Trading Patterns for Beginners
 Practice, Study, Hard Work: One Trader's $900k* Story
 The Strategy Behind This Six-Figure Trader's Success
 How to Read Candlestick Charts
 My Top Three Stock Scans
 Five Power Candlestick Patterns in Stock Trading Strategies by Adam Khoo
 How I Went From Red to Green: A 6-Figure Trader's Story
 6 Tips for Trading the VWAP Hold High-of-Day Pattern
 Traders! Here's the ULTIMATE Beginners Guide to Reading a Candlestick Chart
 7 Tips to Maximize your Trading with a Small Account
 Why CandleStick Wicks Are So Important! ❗✅
 Patterns to Focus On (& Avoid) In the Stock Market
 4 Tips For Trading Breakouts SMARTER
 Top Simple Guidelines to Help You Spot Dip Buys