Best VWAP Indicator Trading Strategy EVER!!! How to use VWAP Indicator Intraday Trading Strategy
Best way to use VWAP Indicator Trading Strategy!!! A tutorial on How to use VWAP Indicator Intraday Trading Strategy / Day Trading Strategies that will work to make money online in Stock Market
Last video: 5 BIG Moving Average Trading Strategy MISTAKES (MUST KNOW) : https://youtu.be/0hrelQHu_2s
first video: I risked MACD Trading Strategy 100 TIMES Here’s What Happened... : https://youtu.be/nmffSjdZbWQ
SUBSCRIBE for more Videos!
so, in this video, we will show you, our best trading indicator, that is key to our trading success! make sure to hit that subscribe button, and ring that notification bell, to see our future videos.
This indicator, is used by institutional brokers. These are the people with big money, who move the market. If the institutional brokers are using it, it is a good idea, to keep it on your trading chart, to make profit.
So first, what is V WAP, and why people with big money, use it. lets look at an example.
so, here, we have an intraday chart. and, here's, the first 3 minute candle, of the day.
the blue line, is the V WAP indicator.
to understand why, V WAP works. imagine this.
lets' say, a broker, wants to buy, some million shares of a stock,
as requested by his client.
the broker won't chase the market, and buy shares at the top.
his goal, is to buy the shares, at a fair price, so his client will be happy.
remember, V WAP stands for Volume Weighted Average Price! therefore, the client will be most likely happy to buy shares at average price, instead buying at the top.
since, professional brokers, are trading at the V WAP line, it is a good idea, to make use of this indicator in our strategy.
okay! so now we understand how it works. lets see how to use it, to make money as a retail trader.
there are few key things to note, about the V WAP indicator.
number 1. V WAP line, will remain same, on all intra day time frames.
if you switch the chart from, 5 minutes, to 15 minutes, the V WAP line, will stay at the same price. This is a good thing. because everyone who is day trading, will see the V WAP line at the same price, unlike a moving average. this will lead to increase in buying and selling, near the V WAP line. increased volume, will increase the chance of getting your order filled, at your defined price.
number 2. V WAP, only works on intra day time frame, and doesn't work on daily.
Number 3. If the stock is trading above the V WAP line, it is considered as an uptrend. Similarly, if the Stock is trading below the V WAP, it is considered as down trend.
Number 4. V WAP line can act as a support, or resistance, on a trading chart.
here's a real life example.
on this stock, look at how it opens with a gap up, then goes up, falls towards the V WAP, and bounces back.
we can see that, V WAP is acting as a support.
and, since market is above the V WAP, we can say, the market is in an up trend.
you can see, how beautifully, price bounced, at the V WAP line, before finally breaking the high of the day.
Obviously, you shouldn't take trades, everytime price reaches the V WAP line. You should wait for the right entry signal, before risking your money.
In this case, we could have bought some shares, at these buy signals, that are near the V WAP line.
lets see a downtrend example. after that, we will see some complex examples, to make sure, V WAP works as intended, and we understand it properly. after all, we don't want to risk our money, on something that doesn't even work!
this stock, opens with a gap up, but was not able to keep the upward momentum.
it finally broke through the V WAP line, starting a good down trend.
then, gave a pullback, but couldn't cross the V WAP.
Since this is a down trend, V WAP line is acting as a Resistance.
You can see, how the price rallied it's way down after touching the V WAP.
you could have sold some shares, with some good entry signals.
You can set the stop loss, above the V WAP line, as price can retest the line, few more times, before finally going in your direction. this chart is little bit more complex than the previous two. But lets break it down.
first, the stock, opens with a gap up,
then hovered on the V WAP line. also, if you haven't noticed it yet, V WAP, is an Intraday Indicator.
therefore, the V WAP line, will start from the body, of the first candle of the day. Okay, let's focus on the chart. the stock, opens with a gap up, then hovered on the V WAP line. after an upward push, it found support at the V WAP.
once it broke below the line, the V WAP was acting as a resistance, then, price rallied down, starting a clear down trend. gave a pullback, and then found resistance at the V WAP line for the second time. you can see, the V WAP worked perfectly on this day.
Like the video if you liked it. and subscribe for more trading videos. Don't forget to ring that notification bell as well. see ya!
Видео Best VWAP Indicator Trading Strategy EVER!!! How to use VWAP Indicator Intraday Trading Strategy канала TRADING RUSH
Показать
Комментарии отсутствуют
Информация о видео
Другие видео канала
 Volume Weighted Average Price Indicator LIVE Trading Strategy !!!
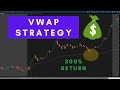 VWAP Trading Strategy || 300% Return
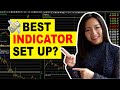 Day Trading Indicator Set Up for Beginners 2020 (How to use VWAP, RSI, MACD Indicators)
 I tested Fibonacci Trading Strategy 100 TIMES to find the truth about Fibonacci Retracements
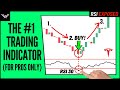 Best RSI Indicator Trading Strategy - Wysetrade Method
 How to Actually Trade with RSI: The real Way (Including MACD and Stochastic)
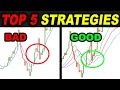 Top 5 BEST Trading Strategies that work with PROOF
 VWAP EXPLAINED | HOW TO USE VWAP TO DAY TRADE (UPDATED FOR 2020)
 4 USEFUL Trading Breakout Tips that can Make You MONEY in TRADING
 5 BIG Moving Average Trading Strategy MISTAKES (MUST KNOW)
 I risked MACD Trading Strategy 100 TIMES Here’s What Happened...
 Live Trading Forex Strategy EVER!!! Made +175 $ in 4 MINUTES on Intraday Trade
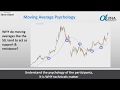 Do You VWAP? What the Anchored VWAP is and How to Use It! | Brian Shannon
 How to Use VWAP EMA Crossover Study - Think or Swim
 How to Grow a Small Trading Account FAST - Day Trading !!
 I took 100 trades with MACD + STOCHASTIC Trading Strategy and the results were...
 VWAP Trading Strategies for Day Trading Beginners (Long & Short set ups)
 How to draw Support and Resistance like a PRO
 VOLUME Trading to find the BIG and Smart Traders