Understanding the Smith Chart
The Smith chart is one of the most important tools in understanding RF impedance and matching networks. This brief tutorial explains what the Smith chart is and how it can be used to represent complex impedances.
Download our free VNA Fundamentals Primer: https://www.rohde-schwarz.com/us/products/test-and-measurement/network-analyzers/fundamentals-of-vector-network-analysis_253352.html?cid=802_us_smo_ALL__20-09_a______yt_TMfundmntls_Smith-Chart
Need help with Rohde & Schwarz products & services?
Contact Us: https://www.rohde-schwarz.com/us/m4c/contact-us_253202.html?cid=802_us_smo_ALL__20-08_i______yt_TMfundmntls_
Видео Understanding the Smith Chart канала Rohde Schwarz
Показать
Комментарии отсутствуют
Информация о видео
Другие видео канала
 #297: Basics of the Smith Chart - Intro, impedance, VSWR, transmission lines, matching
 Understanding Signal Integrity
 #359 How to properly use a NanoVNA V2 Vector Network Analyzer & Smith Chart (Tutorial)
 Understanding S Parameters
 #314: How to use the NanoVNA to sweep / measure an antenna system's SWR and optimize its tuning
 Smith chart basics, part 1
 Understanding Third Order Intercept
 #276: Smith Chart: Design an L-Network - Impedance Matching Circuit
 Understanding VNA Calibration Basics
 smith v4.1 teoria electromagnetica y ondas
 Smith Chart Matching in 10 Minutes
 #275: Smith Chart: Z, VSWR, Reflection Coef and Transmission Line Effects
 Understanding Basic Spectrum Analyzer Operation
 #274: Smith Chart Basics: Impedance and Admittance curves and conversion
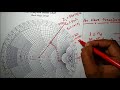 Quarter wave transformer matching Circuit using smith chart by Dr. Niraj Kumar VIT Chennai
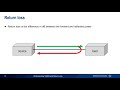 Understanding VSWR and Return Loss
 Impedance Matching 101
 Electro Magnetics - Numerical on Smith Chart