Calculating a Stock's Standard Deviation | Trading Data Science
How understanding standard deviation helps us better understand stock moves and the opportunities that we can trade to take advantage of these moves.
See more options trading videos: http://ow.ly/P0EmG
Today, on this segment of "The Skinny on Options Data Science", Tom Sosnoff and Tony Battista along with our own Dr. Data (Michael Rechenthin, PhD) explain the concept of standard deviation and how to easily use it with free online tools.
The term "standard deviation" is often mentioned when a stock makes a large move. e.g. 'the stock make a two standard deviation move'. This segment explains what that means, how it relates to historical volatility and how we can easily calculate standard deviation using free online tools.
Standard deviation quantifies the amount of variation within data, the larger the standard deviation, the larger the dispersion. We can look at a bell curve of a normal distribution with one, two and three standard deviation moves marked out along with a percentage of move that would fall within each (from the mean) up or down.
Takeaways:
Standard deviation can be used to better understand data.
We can calculate standard deviation of daily stock returns using free Google Sheets.
Historical volatility is the annualized standard deviation of price returns.
Math is the most feared four-lettered word around, even to Tom and Tony. Luckily the well dressed Dr. Data is here to show how to tame the beast and even use it to make money. Check out his segments on analysis and data manipulation to understand the reasoning behind our trades.
You can watch a new Skinny on Options Data Science episode live and check out all previous episodes everyday at http://ow.ly/EoyGW!
======== tastytrade.com ========
Finally a financial network for traders, built by traders. Hosted by Tom Sosnoff and Tony Battista tastytrade is a real financial network with 8 hours of live programming five days a week during market hours. Tune in and learn how to trade options successfully and make the most of your investments!
Subscribe to our YouTube channel: http://goo.gl/s2bAxF
Watch tastytrade LIVE daily Monday-Friday 7am-3:15pmCT: https://goo.gl/OTv3Ez
Follow tastytrade:
Twitter: https://twitter.com/tastytrade
Facebook: https://www.facebook.com/tastytrade
LinkedIn: http://www.linkedin.com/company/tastytrade
Instagram: http://instagram.com/tastytrade
Pinterest: http://www.pinterest.com/tastytrade/
Видео Calculating a Stock's Standard Deviation | Trading Data Science канала tastytrade
Показать
Комментарии отсутствуют
Информация о видео
Другие видео канала
 How to Calculate Expected Stock Moves | Trading Data Science
 Standard Deviation: Short Put 1 SD below Stock Price = 84% Probability of Closing OTM
 Calculating Standard Deviations For Trading; www.SlingshotFutures.com
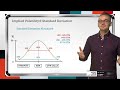 Implied Volatility & Standard Deviation Explained
 Trader Makes 50% Returns Using Vertical Spreads & Iron Condors
 Former Engineer/Lawyer Becomes Full Time Trader with 3 Simple Criteria
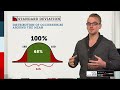 Standard Deviation Explained | Options Trading Concepts
 Managing Gains and Losses in Options Strangles | Trading Data Science
 What is the Difference Between IV Rank & IV Percentile? | Trading Data Science
 Truth Revealed! The Put/Call Ratio | Trading Data Science
 Options Trader Uses tastytrade Mechanics to Get 64% ROC in Just 8 Months!
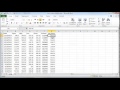 Stock returns: average, variance, and standard deviation
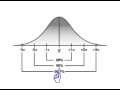 Understanding Standard Deviation in Trading
 John Carter | The 3 Highest Probability Option Trading Setups in the Markets Right Now
 Tom Sosnoff | Ten Trades You Need to Know in Order to Make It in the Business of Finance
 Successfully Predicting or Randomness? | Trading Data Science
 Selling Put Options in Smaller Trading Accounts
 How to Trade Strangles In A Smaller Account
 This Strategy Will Make You A Consistent Trader
 Option Trading : What Kinds of Mistakes Do New Traders Make?