Law of Large Numbers - Explained and Visualized
If you enjoyed this video, you are welcome to support the channel with a small donation via Paypal or Crypto.
Link to PayPal donation https://www.paypal.me/jeremyblitzjones
BTC address 32CdPhrezixVasGSgRwXQzCG76EHCj2oNH
BCH address qpmggyw8yshcgpg579y3n3pxhu8v9sqf9qu2hjrje8
ETH address 0x677Ca2Ca815d324Cbdea9C762B4d07f5707fEFd7
XRP ledger address rK3hyQ4KnS5rCXAoKjDGJgBzNrD5FZbhgq
Video transcript:
How does an insurance company decide how much to charge for car insurance?
How do casinos set up payout structures to make sure that they make a profit?
How does a poker player decide whether or not to fold?
How do we efficiently measure the appeal of a political candidate?
The answers to these questions are informed by the law of large numbers.
The law of large numbers states that as the number of trials or observations increases, the actual or observed probability approaches the theoretical or expected probability.
This is important to understand because it allows us to predict and have confidence in how events will play out in the long run.
Let’s take a common example—flipping a coin. Assuming the coin is fair, we know that the theoretical probability of flipping heads is .5 or 50%. However, that doesn’t guarantee that if we flip a coin 10 times we’ll get 5 heads. But we can be confident that as we continue flipping a coin indefinitely the cumulative proportion of heads flipped should get closer and closer to 50%.
Looking at this graphically helps to illustrate the concept. I just flipped a coin 20 times and these are the results. After each flip, we’ll calculate the cumulative proportion of heads so far. So the first flip is tails, so our current proportion is 0 heads out of 1 flip—0%. The second flip is also tails, so now it’s 0 heads out of 2 flips— still 0% heads. Next flip is tails again— 0%. Then heads, now we have 1 heads out of 4 flips— 25% heads. Flip again and it’s heads—40%. Heads again and we finally hit our theoretical probability of 50% for the first time. Let’s keep going…(video plays out the rest of the 20 flips). This graph shows the observed probability approaching the theoretical probability.
One common misconception, referred to as the gambler’s fallacy, is that if the first four flips were tails, you’re more likely to get heads on the next flip because the proportion is supposed to even out to 50% heads. This is not the case because each flip of a coin is an independent event, its outcome is unaffected by all previous events. So if you start out with four tails in a row, it’s not that you are more likely to get heads, it’s just that in the grand scheme of things, four tails flips will get averaged with a huge number of flips that are expected to yield an even number of heads and tails, causing the proportion to approach 50% as the number of trials increases.
Another version of the law of large numbers explains that the more people from a population that you sample, so the larger your sample size, assuming your sample is free from bias, the closer your sample average will be to the population average.
Let’s say you have a group of 100 people. Each has some number of dollars in their wallet. If we ask one person how much money she has in her wallet, we’ll get our first observation ($49), which might be pretty far from the average of the group. After asking the second person ($29) and averaging that value with the first ($30), we are likely to have a better estimate of the group average. As we continue this process of adding observations and thereby increasing our sample size, we’ll generally get better and better estimates of the group’s average.
SUMMARY
So the law of large numbers gives us a compass with which to navigate the randomness around us. Even though we can never predict the outcome of a single coin flip, we can know that over time about half of the flips will be heads. This knowledge underpins insurance, gambling, and investing. And in general, the principle supports the idea that a well-founded strategy that is followed consistently should win out over time, even though it might result in a few negative events along the way.
Видео Law of Large Numbers - Explained and Visualized канала Jeremy Jones
Показать
Комментарии отсутствуют
Информация о видео
Другие видео канала
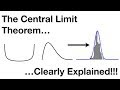 The Central Limit Theorem
 Law of Large Numbers – Learn It In 8 min
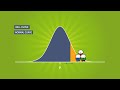 The Normal Distribution and the 68-95-99.7 Rule (5.2)
 Lecture 29: Law of Large Numbers and Central Limit Theorem | Statistics 110
 The reason casinos always win: meet the law of large numbers
 Neil deGrasse Tyson Explains Big Numbers
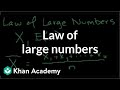 Law of large numbers | Probability and Statistics | Khan Academy
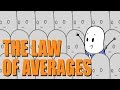 Law Of Averages - How To Be Successful In Anything You Do
 Introduction to the Central Limit Theorem
 Addition Rule of Probability - Explained
 Law of Large Numbers in Python
 How to Calculate Standard Deviation
 Mathematics is the queen of Sciences
 Z-Scores, Standardization, and the Standard Normal Distribution (5.3)
 Law of Large Numbers in Insurance
 The law of large numbers - Trading like a casino - investing 101
 L18.4 The Weak Law of Large Numbers
 Kurt Vonnegut on the Shapes of Stories
 10 Levels of Financial Independence And Early Retirement | How to Retire Early
 Standard Deviation - Explained and Visualized