The Spectrogram and the Gabor Transform
Here I introduce the spectrogram, which is a moving-window Fourier transform, giving insight into the time-frequency content of a data set.
Book Website: http://databookuw.com
Book PDF: http://databookuw.com/databook.pdf
These lectures follow Chapter 2 from:
"Data-Driven Science and Engineering: Machine Learning, Dynamical Systems, and Control" by Brunton and Kutz
Amazon: https://www.amazon.com/Data-Driven-Science-Engineering-Learning-Dynamical/dp/1108422098/
Brunton Website: eigensteve.com
Видео The Spectrogram and the Gabor Transform канала Steve Brunton
Показать
Комментарии отсутствуют
Информация о видео
Другие видео канала
![Spectrogram Examples [Matlab]](https://i.ytimg.com/vi/2mB74QhDznI/default.jpg) Spectrogram Examples [Matlab]
Spectrogram Examples [Matlab]![Denoising Data with FFT [Python]](https://i.ytimg.com/vi/s2K1JfNR7Sc/default.jpg) Denoising Data with FFT [Python]
Denoising Data with FFT [Python]

 Inner Products in Hilbert Space
 Tutorial 74 - What are Gabor filters and how to use them to generate features for machine learning?
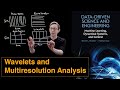 Wavelets and Multiresolution Analysis
 Spectrograms: an Introduction
 An introduction to the wavelet transform (and how to draw with them!)
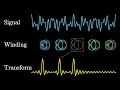 But what is the Fourier Transform? A visual introduction.
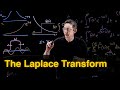 The Laplace Transform: A Generalized Fourier Transform
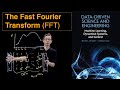 The Fast Fourier Transform (FFT)
![Solving PDEs with the FFT [Python]](https://i.ytimg.com/vi/hDeARtZdq-U/default.jpg) Solving PDEs with the FFT [Python]
Solving PDEs with the FFT [Python] 58 - What are Gabor filters?
 The Short Time Fourier Transform | Digital Signal Processing
 Restoring and Improve Your Vision Naturally With One Lesson
 Sparsity and the L1 Norm
![Spectrogram Examples [Python]](https://i.ytimg.com/vi/TJGlxdW7Fb4/default.jpg) Spectrogram Examples [Python]
Spectrogram Examples [Python] Image Compression and Wavelets (Examples in Matlab)
 Singular Value Decomposition (SVD): Mathematical Overview