- Популярные видео
- Авто
- Видео-блоги
- ДТП, аварии
- Для маленьких
- Еда, напитки
- Животные
- Закон и право
- Знаменитости
- Игры
- Искусство
- Комедии
- Красота, мода
- Кулинария, рецепты
- Люди
- Мото
- Музыка
- Мультфильмы
- Наука, технологии
- Новости
- Образование
- Политика
- Праздники
- Приколы
- Природа
- Происшествия
- Путешествия
- Развлечения
- Ржач
- Семья
- Сериалы
- Спорт
- Стиль жизни
- ТВ передачи
- Танцы
- Технологии
- Товары
- Ужасы
- Фильмы
- Шоу-бизнес
- Юмор
Integrating Population & Literacy Data Using Attribute Join | MAPOG Map Analysis #DataMapping #gis
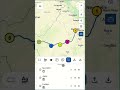
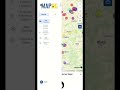
Understanding demographic trends and education levels is crucial for effective policy-making and resource allocation. With MAPOG's Attribute Join tool, you can merge population and literacy rate data to uncover insights about literacy distribution across different regions.
🔍 What You’ll Learn in This Tutorial:
✅ How to perform Attribute Join in MAPOG
✅ Step-by-step guide to merging population and literacy rate data
✅ How to visualize educational disparities using GIS tools
✅ Real-world applications in education planning, policymaking, and NGO initiatives
MAPOG simplifies data integration and geospatial analysis, making it an essential tool for government bodies, educators, researchers, and NGOs to drive data-informed decisions.
📌 Try MAPOG Now 👉 https://story.mapog.com/app?utm_source=Youtube&utm_medium=YoutubeVideo&utm_campaign=mapanalysis
📩 Need support? Contact us at support@mapog.com
🎥 Like, Share & Subscribe for more GIS tutorials! 👍
#MAPOG #AttributeJoin #GISAnalysis #EducationData #DataVisualization #PopulationMapping #GeospatialAnalysis #DataIntegration #SmartEducation #PolicyMaking #NGOInsights #MappingLiteracy #GISMapping #LocationIntelligence
Видео Integrating Population & Literacy Data Using Attribute Join | MAPOG Map Analysis #DataMapping #gis канала MAPOG
Комментарии отсутствуют
Информация о видео
3 марта 2025 г. 9:43:02
00:02:30
Другие видео канала