- Популярные видео
- Авто
- Видео-блоги
- ДТП, аварии
- Для маленьких
- Еда, напитки
- Животные
- Закон и право
- Знаменитости
- Игры
- Искусство
- Комедии
- Красота, мода
- Кулинария, рецепты
- Люди
- Мото
- Музыка
- Мультфильмы
- Наука, технологии
- Новости
- Образование
- Политика
- Праздники
- Приколы
- Природа
- Происшествия
- Путешествия
- Развлечения
- Ржач
- Семья
- Сериалы
- Спорт
- Стиль жизни
- ТВ передачи
- Танцы
- Технологии
- Товары
- Ужасы
- Фильмы
- Шоу-бизнес
- Юмор
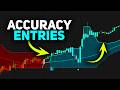
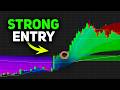
Fix Bad Entries & Optimize Snapback Trades – NEW TradingView Precision Setup
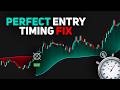
Most traders don’t lose because they’re wrong —
they lose because they chase price, enter late, and react emotionally.
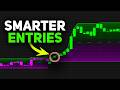
In this video, I’ll show you how to optimize TradingView for snapback trading using two elite Chart Prime indicators that expose market extremes and hidden momentum shifts.
This setup is built to:
🎯 Fix late entries
📉 Reduce emotional trades
⚡ Optimize mean-reversion execution
🧠 Trade data, not excitement
No guessing. No chasing. Just confirmed snapback entries.
🛠️ INDICATORS, SETTINGS & PATHS USED
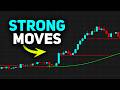
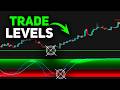
Indicator 1: Linear Regression Channel (Chart Prime)
Path:
TradingView → Indicators → Search → Linear Regression Channel
Creator: Chart Prime
Settings Path:
Indicator Settings → Input Tab
Length: 150
Deviation: 3
Why this boosts performance:
Filters short-term noise
Defines true market extremes
Improves snapback accuracy
Style Tab Settings:
Enable: Plot Future Projection
Enable: Arrow Direction
Hide unnecessary visuals
Indicator 2: RSI Momentum Divergence Zones (Chart Prime)
Path:
TradingView → Indicators → Search → RSI Momentum Divergence Zones
Creator: Chart Prime
Settings Path:
Indicator Settings → Style Tab
Hide all non-essential visuals
Keep divergence zones visible
Input Tab:
Leave defaults (already optimized)
📊 HOW THE SETUP WORKS (Execution Optimization)
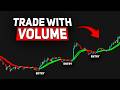
BUY CONDITIONS
Price touches or breaks lower regression band
Blue diamond appears (oversold extreme)
Green RSI divergence zone prints (bullish momentum shift)
Next candle closes bullish
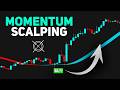
SELL CONDITIONS
Price touches or breaks upper regression band
Red diamond appears (overbought extreme)
Red RSI divergence zone prints (bearish momentum shift)
Next candle closes bearish
🧠 RISK MANAGEMENT (Latency & Emotion Control)
Stop-Loss:
Below green RSI zone (buy)
Above red RSI zone (sell)
Take-Profit:
Middle line of Linear Regression Channel (mean price)
Prevents chasing, revenge trading, and overexposure
This strategy works because:
Linear Regression defines true extremes
RSI Divergence exposes hidden momentum
Trades trigger only when both align
Risk is logical, clean, and controlled
👍 If this helped you trade cleaner and smarter:
Like the video
Subscribe for more TradingView optimization strategies
Turn on notifications so you never miss a setup
Видео Fix Bad Entries & Optimize Snapback Trades – NEW TradingView Precision Setup канала Gray Candle
they lose because they chase price, enter late, and react emotionally.
In this video, I’ll show you how to optimize TradingView for snapback trading using two elite Chart Prime indicators that expose market extremes and hidden momentum shifts.
This setup is built to:
🎯 Fix late entries
📉 Reduce emotional trades
⚡ Optimize mean-reversion execution
🧠 Trade data, not excitement
No guessing. No chasing. Just confirmed snapback entries.
🛠️ INDICATORS, SETTINGS & PATHS USED
Indicator 1: Linear Regression Channel (Chart Prime)
Path:
TradingView → Indicators → Search → Linear Regression Channel
Creator: Chart Prime
Settings Path:
Indicator Settings → Input Tab
Length: 150
Deviation: 3
Why this boosts performance:
Filters short-term noise
Defines true market extremes
Improves snapback accuracy
Style Tab Settings:
Enable: Plot Future Projection
Enable: Arrow Direction
Hide unnecessary visuals
Indicator 2: RSI Momentum Divergence Zones (Chart Prime)
Path:
TradingView → Indicators → Search → RSI Momentum Divergence Zones
Creator: Chart Prime
Settings Path:
Indicator Settings → Style Tab
Hide all non-essential visuals
Keep divergence zones visible
Input Tab:
Leave defaults (already optimized)
📊 HOW THE SETUP WORKS (Execution Optimization)
BUY CONDITIONS
Price touches or breaks lower regression band
Blue diamond appears (oversold extreme)
Green RSI divergence zone prints (bullish momentum shift)
Next candle closes bullish
SELL CONDITIONS
Price touches or breaks upper regression band
Red diamond appears (overbought extreme)
Red RSI divergence zone prints (bearish momentum shift)
Next candle closes bearish
🧠 RISK MANAGEMENT (Latency & Emotion Control)
Stop-Loss:
Below green RSI zone (buy)
Above red RSI zone (sell)
Take-Profit:
Middle line of Linear Regression Channel (mean price)
Prevents chasing, revenge trading, and overexposure
This strategy works because:
Linear Regression defines true extremes
RSI Divergence exposes hidden momentum
Trades trigger only when both align
Risk is logical, clean, and controlled
👍 If this helped you trade cleaner and smarter:
Like the video
Subscribe for more TradingView optimization strategies
Turn on notifications so you never miss a setup
Видео Fix Bad Entries & Optimize Snapback Trades – NEW TradingView Precision Setup канала Gray Candle
tradingView optimization fix bad entries reduce chasing price snapback trading setup Linear Regression Channel fix late entries trading precision boost day trading system trend extremes strategy TradingView scalping TradingView day trading high probability trades price extreme trading regression channel strategy RSI divergence trading trade execution improvement trading performance boost TradingView tips 2025 optimize TradingView charts
Комментарии отсутствуют
Информация о видео
29 января 2026 г. 23:38:58
00:09:38
Другие видео канала