- Популярные видео
- Авто
- Видео-блоги
- ДТП, аварии
- Для маленьких
- Еда, напитки
- Животные
- Закон и право
- Знаменитости
- Игры
- Искусство
- Комедии
- Красота, мода
- Кулинария, рецепты
- Люди
- Мото
- Музыка
- Мультфильмы
- Наука, технологии
- Новости
- Образование
- Политика
- Праздники
- Приколы
- Природа
- Происшествия
- Путешествия
- Развлечения
- Ржач
- Семья
- Сериалы
- Спорт
- Стиль жизни
- ТВ передачи
- Танцы
- Технологии
- Товары
- Ужасы
- Фильмы
- Шоу-бизнес
- Юмор
Cool Features in Stock Rover - Save Screener Results as a Portfolio to Track Performance + More
You can check out an exclusive free trial of Stock Rover here: https://www.stockrover.com/tradethatswing-plans
In this video, I go over some cool features in Stock Rover. It is a robust platform for analyzing stocks and portfolios, creating watchlists, and connecting your brokerage accounts to analyze your holdings using Stock Rover tools.
Here are the tools I cover in this video:
--Import Portfolios from famous investors or import pre-made screeners from the Library.
--When you create a screener, you can track how the stocks in that screener perform over time by right-clicking on the screener and clicking "Snapshot screener results." You then click on your watchlists tab to chart the performance of that watchlist over time (compare to the S&P 500 if you like, on the chart).
--You can also create a portfolio from the screener results. With your screener results showing in the table, click the first stock, hold down the Shift key, and scroll down to the last stock and click it. Release the Shift key. All the stock should now be highlighted. Right-click anywhere on the list and click "Trade in portfolio." You will now have a portfolio that includes all the stocks on the list at the current price and time of the portfolio creation.
--The thing I really like about this software is the Insights panel. I primarily use the EPS tab to see if EPS and sales are increasing over time.
The dividend tab is also helpful for seeing how dividends have changed over time.
The Monthly Returns tab shows seasonality in the stock price.
The Analyst tab shows what analyst forecasts are for this year and beyond, as well as how estimates have changed recently. For a long-term investment, I want to see rising sales and ESP, so I will look at analysts' forecasts for this year and next to see if they are higher than the prior year. This shows the upward trend in EPS and Sales is likely to stay intact.
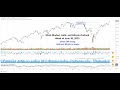
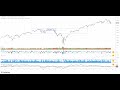
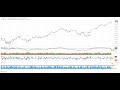
The chart is then used to highlight timing for a potential purchase.
You can check out an exclusive free trial of Stock Rover here: https://www.stockrover.com/tradethatswing-plans
Cory Mitchell, CMT
https://tradethatswing.com/ - Loads of resources on trading stocks, forex, ETFs, day trading, swing trading, and investing
Instagram: https://www.instagram.com/corymitc/
Twitter: https://twitter.com/corymitc
Facebook: https://www.facebook.com/tradethatswing
Threads: https://www.threads.net/@corymitc
Disclaimer: Trading involves a substantial risk of loss. It is possible to lose more than what is deposited if using leverage. There are no guarantees of success. Trading is a difficult task to make consistent money at; only a small percentage of people who attempt it can make income from it. This is not a recommendation to buy or sell anything. The links above are affiliate links. This channel may receive compensation, at no cost to you, if you sign up for the product. Thank you for supporting the channel in this wya.
Видео Cool Features in Stock Rover - Save Screener Results as a Portfolio to Track Performance + More канала Cory Mitchell Trading
In this video, I go over some cool features in Stock Rover. It is a robust platform for analyzing stocks and portfolios, creating watchlists, and connecting your brokerage accounts to analyze your holdings using Stock Rover tools.
Here are the tools I cover in this video:
--Import Portfolios from famous investors or import pre-made screeners from the Library.
--When you create a screener, you can track how the stocks in that screener perform over time by right-clicking on the screener and clicking "Snapshot screener results." You then click on your watchlists tab to chart the performance of that watchlist over time (compare to the S&P 500 if you like, on the chart).
--You can also create a portfolio from the screener results. With your screener results showing in the table, click the first stock, hold down the Shift key, and scroll down to the last stock and click it. Release the Shift key. All the stock should now be highlighted. Right-click anywhere on the list and click "Trade in portfolio." You will now have a portfolio that includes all the stocks on the list at the current price and time of the portfolio creation.
--The thing I really like about this software is the Insights panel. I primarily use the EPS tab to see if EPS and sales are increasing over time.
The dividend tab is also helpful for seeing how dividends have changed over time.
The Monthly Returns tab shows seasonality in the stock price.
The Analyst tab shows what analyst forecasts are for this year and beyond, as well as how estimates have changed recently. For a long-term investment, I want to see rising sales and ESP, so I will look at analysts' forecasts for this year and next to see if they are higher than the prior year. This shows the upward trend in EPS and Sales is likely to stay intact.
The chart is then used to highlight timing for a potential purchase.
You can check out an exclusive free trial of Stock Rover here: https://www.stockrover.com/tradethatswing-plans
Cory Mitchell, CMT
https://tradethatswing.com/ - Loads of resources on trading stocks, forex, ETFs, day trading, swing trading, and investing
Instagram: https://www.instagram.com/corymitc/
Twitter: https://twitter.com/corymitc
Facebook: https://www.facebook.com/tradethatswing
Threads: https://www.threads.net/@corymitc
Disclaimer: Trading involves a substantial risk of loss. It is possible to lose more than what is deposited if using leverage. There are no guarantees of success. Trading is a difficult task to make consistent money at; only a small percentage of people who attempt it can make income from it. This is not a recommendation to buy or sell anything. The links above are affiliate links. This channel may receive compensation, at no cost to you, if you sign up for the product. Thank you for supporting the channel in this wya.
Видео Cool Features in Stock Rover - Save Screener Results as a Portfolio to Track Performance + More канала Cory Mitchell Trading
Комментарии отсутствуют
Информация о видео
21 декабря 2025 г. 4:01:55
00:28:02
Другие видео канала